Dashboar problem after upgrading 2024.3.10.3
Good morning,
after the last update (2024.3.10.3) we have problems to visualize the “Dashboard” section of the connections.
Some of them look like this: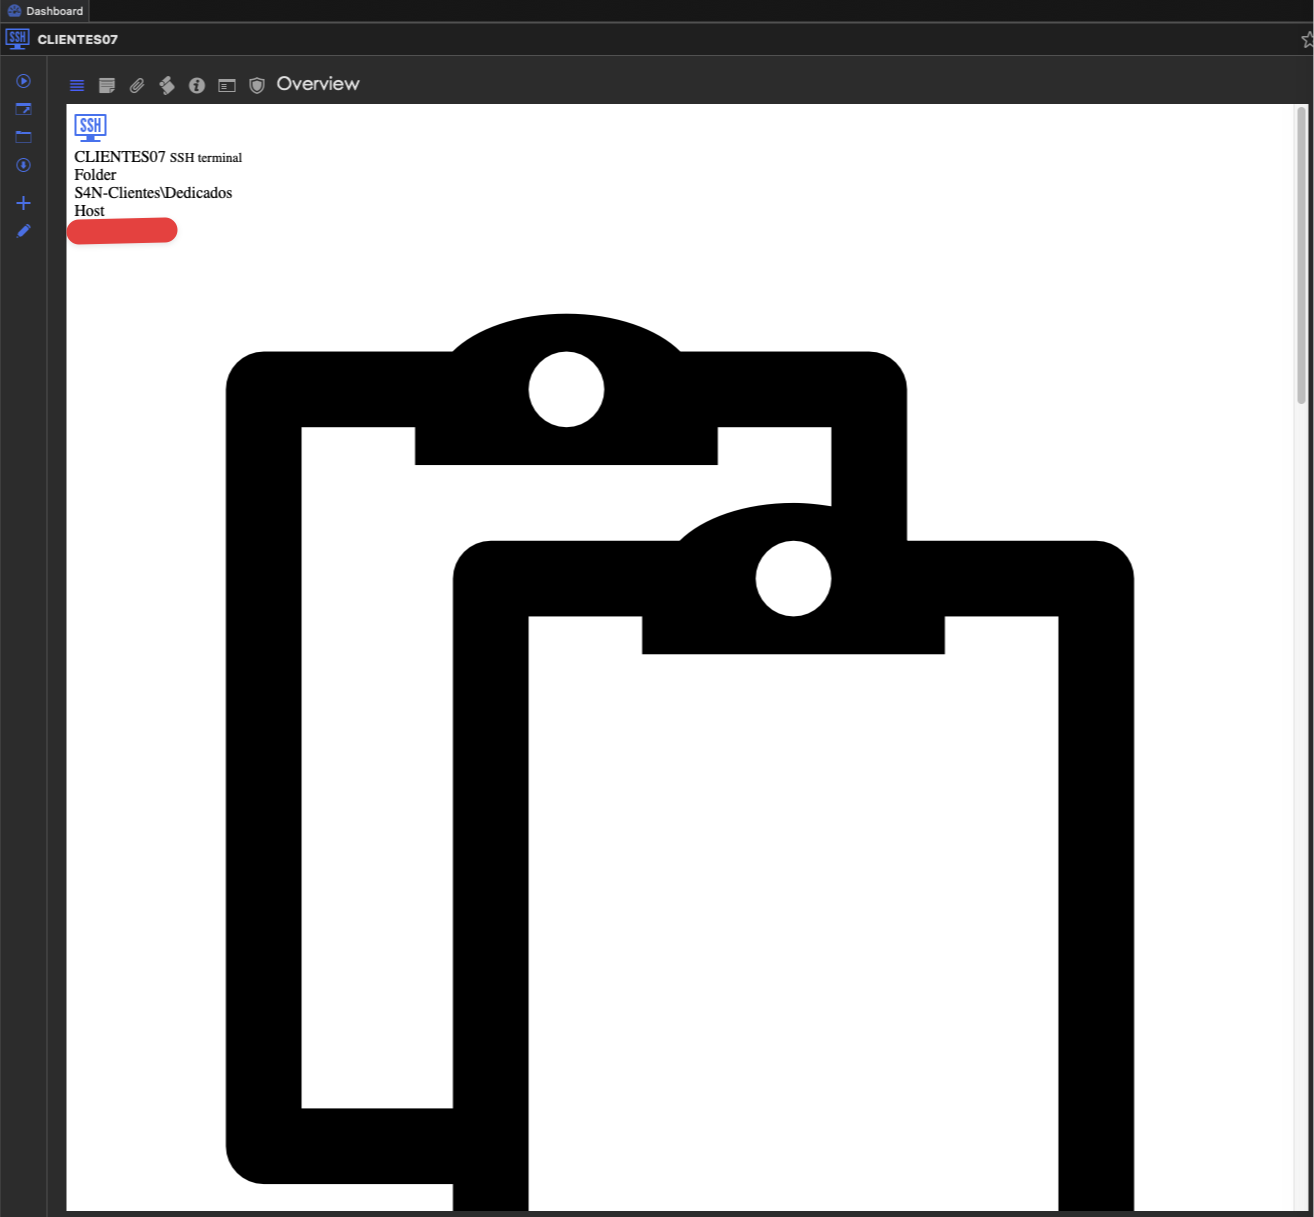
and others directly blank.
b88528db-52d3-4e47-8c3b-4b3c64d5eb57.png
CleanShot 2025-02-06 at 11.19.10.png
CleanShot 2025-02-06 at 11.17.33.png
All Comments (5)
Hello,
We are aware of this issue and we will release a fix for it as soon as possible. We will let you know once we have updates.
Best regards,
Maxim Buisson
In case it helps, I did a clean install on a new MacBook and it worked correctly until I restarted the computer, at which point it started giving the same error.
Good morning,
I can confirm that I am also experiencing the same issue.
I have tried uninstalling and reinstalling the program, but now the Dashboard appears completely blank.
This is very inconvenient.
I hope this problem will be resolved quickly.
Thank you in advance for your support.
Running it from the terminal with all the debugs flags, this error pops up in the terminal when displaying the dashboard, in case it helps you in any way:
ERROR SILENT System.PlatformNotSupportedException: PlatformNotSupported_ThreadAbort
   at System.Threading.Thread.Abort()
   at Devolutions.RemoteDesktopManager.Business.HttpBrowserLinker.StopHttp()
Hello,
Thank you for your patience.
I can confirm that the issue has been fixed in the 2024.3.29.0 update, and the dashboard should now be functioning normally.
Please feel free to reach out if you encounter the issue again.
Best regards,
Jacob Lafrenière