Performance Issues

Hi Sam,
Here's what I'm seeing performance-wise:
- closing a tab: There's a 2–3 second delay before the mouse cursor even comes back
- opening an RDP session: It takes about 2–3 seconds before it actually starts connecting
- launching the application: It takes 10–20 seconds before the workspace is fully loaded and usable
- editing entries: It's fine on reasonably powerful machines, but on systems with mobile CPUs or less RAM, it gets painfully slow
I'm using RDM on three different Windows 11 machines with the same account (and therefore same data source and number of entries) on a daily basis:
- a fairly powerful desktop with an AMD Ryzen 7 7800x3D, 64 GB DDR5-6000 RAM, NVMe SSDs
- a somewhat older laptop with an Intel Core i7-1185G7, 32 GB DDR4-RAM, NVMe SSD
- and a virtual machine running on that laptop, 2 vCPUs, 8 GB RAM
Even on my Ryzen desktop, RDM still feels super slow compared to other applications. It just seems like RDM isn't particularly well optimized.
My Intel laptop is... okay-ish, but still much laggier than it should be.
And let's not even talk about the VM. Launching RDM can sometimes take up to a minute from clicking the shortcut until the workspace is fully loaded.
If you need any additional information or want me to try something on my end, just let me know. I'm happy to help with testing.
Best regards,
All Comments (12)
Hello,
Thank you for your patience on the matter.
Could you follow the steps in these two articles and send us the resulting files?
That will let us look at actual data from your environment rather than general settings.
I will send you a link via DM where you can upload the files.
Please let us know once they have been uploaded.
Thank you in advance!
Best regards,
Sam
I would like to add, that I am experiencing the same incredible slowness of the app.
UnigetUI, even after the Avalonia Upgrade is not nearly as slow as RDM, which literally takes 10+ seconds just to start on a 12 core machine.
I have no time to do some performance profiling at this point. I just want to note that OP is not alone.
Hello @Spagettifritz
Could you please answer @Sam Moynihan's question to help us with the investigation?
Best regards,
Tommy Sanders
Hi Sam, hi Tommy,
Sorry, I didn't get a notification about the new thread.
I'm currently trying to collect the diagnostic data using the two articles you linked.
However, I'm confused by the instructions. They mention collecting diagnostics from multiple menus, but the export process always generates files with the same names. It's therefore unclear whether I'm expected to overwrite the previous export, rename the files manually after each export, or whether I'm missing a step in the process.
Could you clarify the exact workflow you would like me to follow? Should I export diagnostics separately for each window/view? Should I rename the exported files after each capture? Or is there another way to collect diagnostics for multiple UI components in a single session?
Best regards,
I just created a support ticket (00124616) where I reported the same and would to add that @Spagettifritz is not alone. Especially closing tabs freezes the app for several seconds.
--
Citrix Technology Advocate (CTA) at https://www.meinekleinefarm.net
@Marco Hofmann @Martin
Have the Profiler window open while you perform the slow actions. If it captures anything interesting, feel free to post it here.
Use these settings (this is the sweet spot):
- Profiler Level: 1
- Auto Mode: Enabled
- Threshold: 100ms
Info: Enabling too many profiler level flags, especially a few of the more verbose ones, can and will negatively affect performance. Start with Level 1, and Auto Mode is always preferred.
Best regards,
Stéfane Lavergne
Hi all,
So, I still don't really understand how to generate those log files from "workstation info" and "system diagnostics", but I managed to capture a few actions on my (fast) desktop computer, (medium performance) notebook and my (rather "meh") virtual machine.
I could not replicate the exact steps on all machines, as I did tests with different RDP target machines to connect to (I don't have access to all target machines from all of my machines).
So I did as follows:
- RDM is already open and "idle" - meaning, no connection is active, no sync happening, nothing but just waiting to connect to somewhere
- open a connection to machine 1, tab active
- open a connection to machine 2, tab active
- change tab to machine 1
- log off from machine 1
- log off from machine 2
and here are the results:
My (fast) desktop computer: attachment "pc profiler.txt"
My (medium performance) notebook: attachment "notebook profiler.txt"
and my (rather "meh" VM): attachment "vm profiler.txt"
...needless to say, that I removed all critical info including the hostnames and RDM entry names about our machines from the log...
For my daily work, these are quite easy tasks for RDM and still, it feels... somehow sluggish. It's quite common for me to have multiple connections open, up to 15 or 20 at a time.
Switching tabs, opening new connections, closing connections or navigating in the RDM tree sometimes feels just awfully slow.
Funnily, the lags I mentioned in the first post of this new thread...
closing a tab: There's a 2–3 second delay before the mouse cursor even comes back
opening an RDP session: It takes about 2–3 seconds before it actually starts connecting
...are occurring during daytime, but now as I test things after work hours, it gets significantly better across all machines.
Since the last update, 2026.2.13, it also feels like RDM has a new problem with the UI.
- RDM is open on 2nd monitor, I'm working on the 1st monitor
- I double click an entry in the connection tree list, it selects it but doesn't open
- I have to double click again for RDM to recognize the double click and then it starts the connection process
Seems to occur when trying to open a connection when RDM wasn't the active window prior to the double click and looks like you have to "activate" the RDM window by clicking somewhere into RDM first.
I hope this is helpful to you.
Best regards,
vm profiler.txt
pc profiler.txt
notebook profiler.txt
Hi all,
recent profiler output from within my VM - this is right-clicking a folder and going to properties.
Although in this output, the times are better, because this was the 2nd time I had to edit a folder. The 1st time going into the properties of a folder today was nearly 3 seconds of waiting until the window opens. (But I didn't have the profiler open to capture it...)
=== Main Thread ===
        LoadConnections [Devolutions Cloud Free : Devolutions Hub Personal - User Settings Vault] - ReadOnly...
            LoadConnectionsFromDataSource...
                GetConnections : 485 ms
            LoadConnectionsFromDataSource : 486 ms
        LoadConnections [Devolutions Cloud Free : Devolutions Hub Personal - User Settings Vault] - ReadOnly : 486 ms
        LoadGlobalAndUserVaults...
            GlobalConnectionManager.Refresh...
                LoadConnections [Devolutions Cloud Free : Devolutions Hub Personal - Global Vault] - ReadOnly...
                    · HasChanged...
                        · TryGetVaultTransactionStateFromCache...
                            · EnsureVaultShortFresh : 164 ms
                        · TryGetVaultTransactionStateFromCache : 164 ms
                    · HasChanged : 164 ms
                LoadConnections [Devolutions Cloud Free : Devolutions Hub Personal - Global Vault] - ReadOnly : 164 ms
Empty global vault
            GlobalConnectionManager.Refresh : 164 ms
            PrivateConnectionManager.Refresh...
                LoadConnections UI - [Devolutions Cloud Free : Devolutions Hub Personal - User Vault] - [User : xxx] - ReadOnly...
                    HasChanged...
                        · TryGetVaultTransactionStateFromCache...
                            · EnsureVaultShortFresh : 192 ms
                        · TryGetVaultTransactionStateFromCache : 192 ms
                    HasChanged : 192 ms
                    Reload: False - HasSecurityChanged: False - HasChanged: False
                LoadConnections UI - [Devolutions Cloud Free : Devolutions Hub Personal - User Vault] - [User : xxx] - ReadOnly : 192 ms
            PrivateConnectionManager.Refresh : 192 ms
        LoadGlobalAndUserVaults : 359 ms
        LoadFolders...
            FavoriteManager.LoadFolders : 2 ms
        LoadFolders : 2 ms
    LoadConnections [Devolutions Cloud Free : Devolutions Hub Personal] - ReadOnly - 64-bit : 1078 ms
· FreConnectionGeneralCredentials.LoadCredentialSessions : 1079 ms
Hub Data Source - Saving connection MRU
Best regards,
Do you have Force refresh before editing an entry enabled? (File > Options > Entry types > Sessions)
If so, disabling it will make the edit window open faster.
The tradeoff is that you might occasionally edit an outdated version of an entry. You can manually refresh from time to time to reduce the chances of working with stale data. If you do end up editing an outdated version, you can use the entry history to recover any lost changes.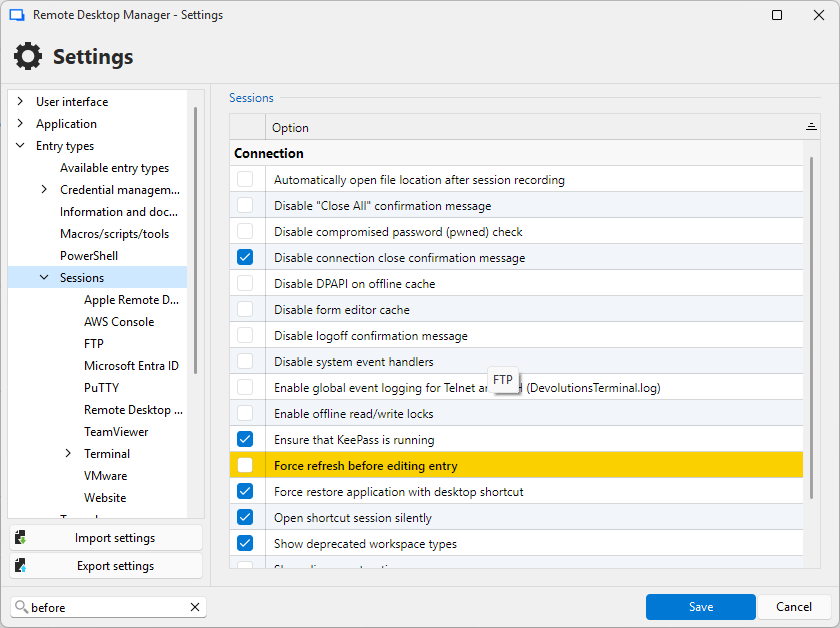
Stéfane Lavergne
313b5bc9-7c57-4dee-808c-8aaadba6adb7.png
Hi Stéfane,
This option already is disabled on my side - on all of my clients.
Hey guys,
two months passed without any update here.
With 2026.3.8, performance actually got way worse for me. I also ran into additional UI issues, like connections constantly detaching from the tab bar into separate windows, and opening a connection takes ages.
I eventually had to downgrade to the latest 2026.2.x version because 2026.3.x was simply not usable for my daily work.
I also noticed that cloud.devolutions.com has roughly 90-125 ms latency from most European locations, while the US East Coast is closer to 10-25 ms.
If RDM performs synchronous checks against the cloud data source during common actions like opening or editing entries, that could easily explain at least part of the sluggishness.
I don't know to what extent a cache is involved, but from a user perspective it really doesn't feel like it is used at all.
At this point I'd mainly appreciate an update on whether the profiler data showed anything useful and whether this is actively being investigated.
Hi @Spagettifritz,
Sadly, the posted profiler data doesn't help much. Yes, loading entries takes 1 second. Half of that is getting them from the server. How many entries do you have in your vault? Could you try changing the profiler level to 2049 (API & debug) and do some slow actions again?
Devolutions Cloud (legacy Personal) is hosted in Canada East. Have you tried pinging our Europe (FR) location? Maybe consider moving to Europe or even the US if the pings are better for you. Since the move to Devolutions Cloud, the former Hub Business regions are now open to all: Europe, America (US & CA), and Australia.
Would you be willing to do a support call so that we can explore your issues with you?
Thanks, have a good day!
Maxime Morin