High energy usage while doing nothing
Hi,
I have noticed that RDM has high energy usage on my Mac Book Pro M3 (newest macOS) even when I have no sessions open to anything. I'm looking at the "Energy impact" column of Activity Monitor. It's not un-normal to see it at around 80-90 but might drop down to 10, however, other apps like Microsoft Edge and Microsoft Teams sits even lower at 1-3 and Edge has multiple active (not sleeping) tabs open and Teams is always waiting for messages to pop in. Other apps might get high some high numbers but fall down to near 0 again quickly. RDM shouldn't really be doing anything so I'm wondering what is going on.
Hope you could shine some light on what is going on and if you can fix it so the battery is not drained unnecessarily.
These are all screenshots taken while RDM has no sessions open and RDM has not been used for over 20 minutes.
First screenshot is while I'm in a Teams Meeting (oops, I should probably had paid more attention there!) with video and another person is presenting, so that is why it's high. Edge is at 8.8. RDM however is idling at 90!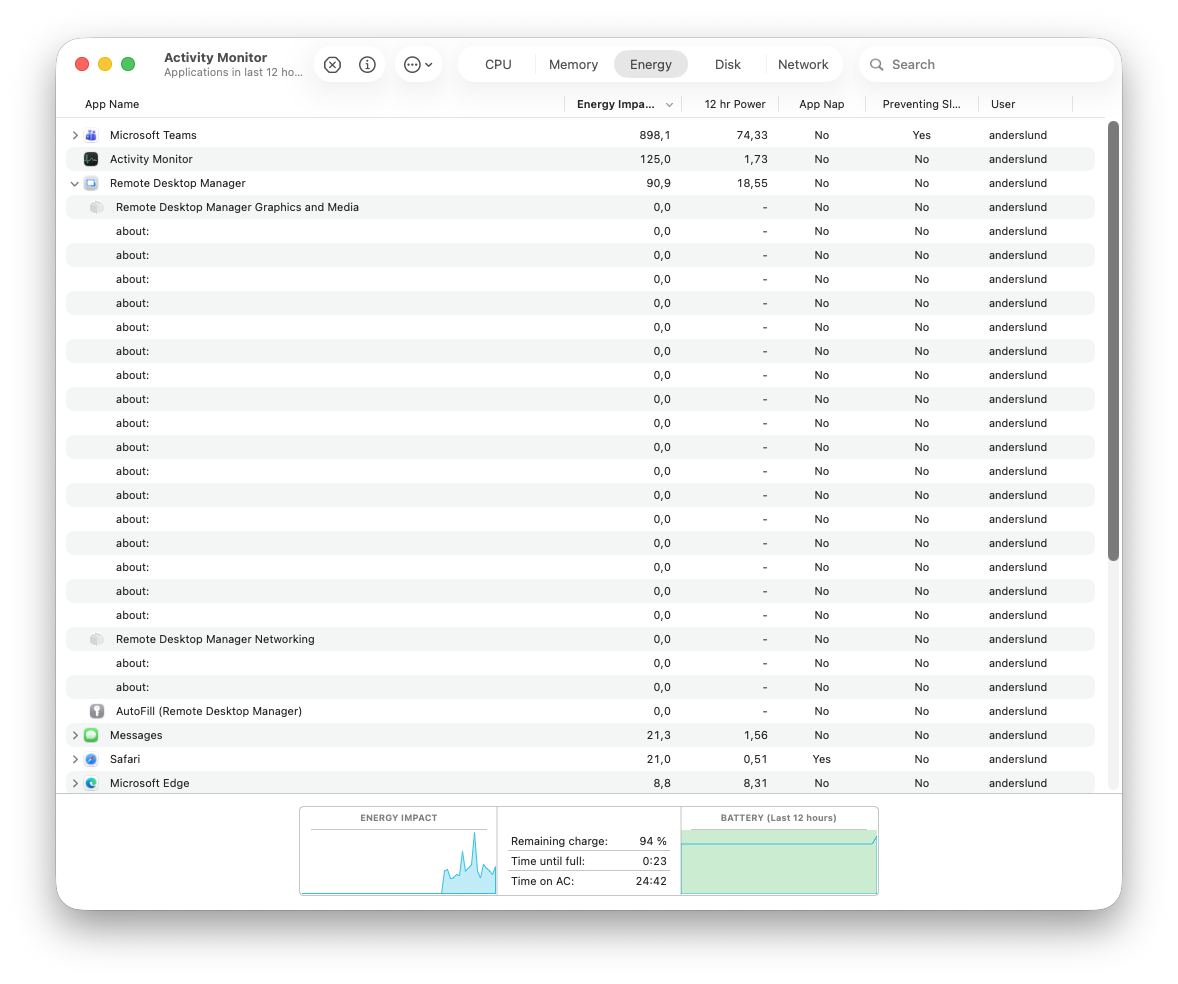 Second screenshot is after the Teams meeting and RDM has fallen quite a bit in Energy Impact but is still using a lot when it is not actually doing anything. Edge has 12 open tabs that are not sleeping.
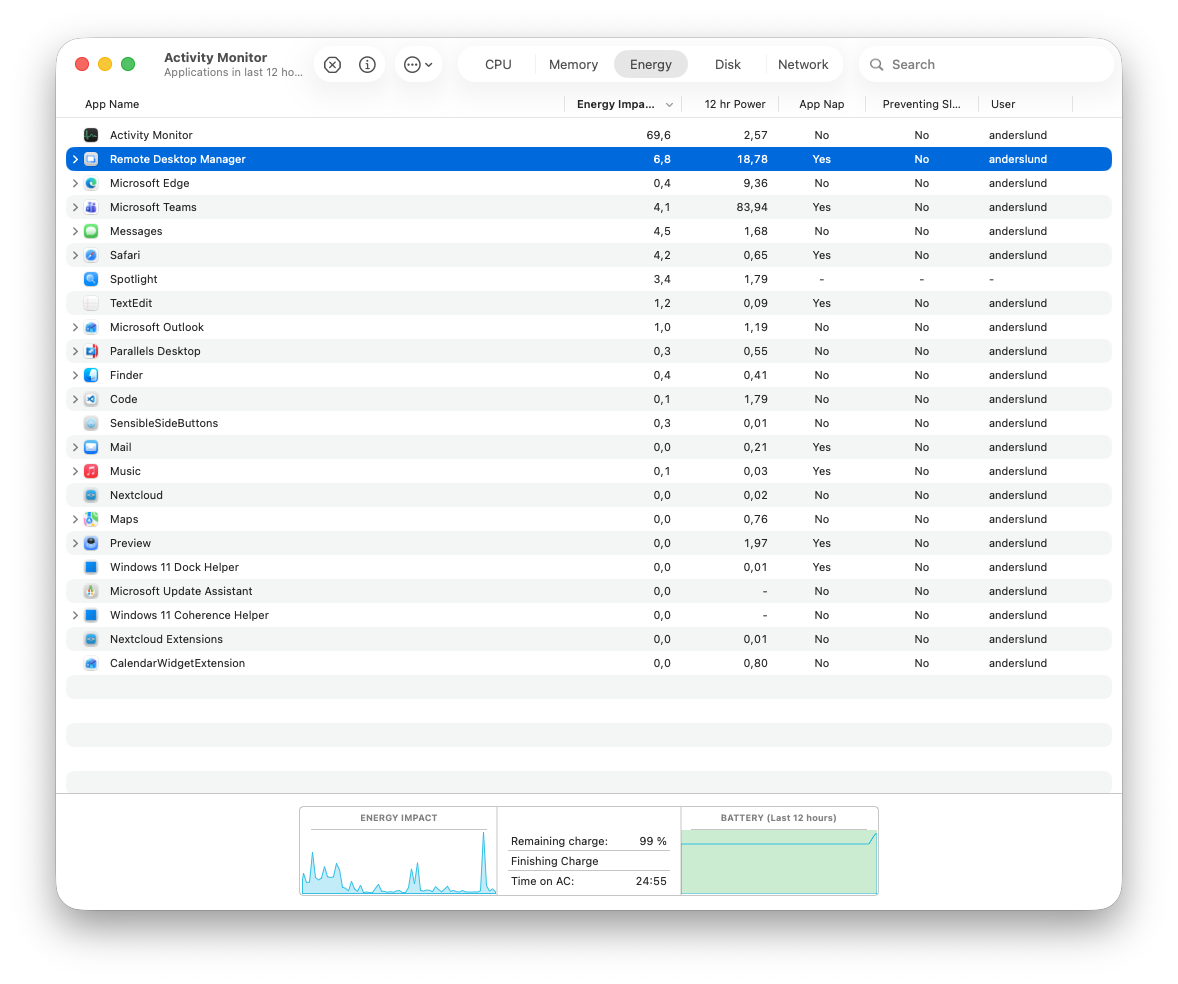
aeb265f8-92ac-44e9-8433-c582e5549142.png
329fc325-a5ca-41b9-acf9-63bc243904e8.png
All Comments (56)
Hello,
Thank you for your feedback.
What RDM version and data source type are you using?
I'm running RDM version 2025.3.6.9 on the same machine connected to a Devolutions Server data source, and RDM is idling between 2.0 to 4.0.
Best regards,
Érica Poirier
Hi Erica,
I'm using 2025.3.6.9 as well but using a Azure SQL Server as data source. macOS is 26.1. I would say 2 to 4 while RDM that is doing nothing is a lot compared to Edge with 12 active tabs open. But of cause, it is much better than what I'm seeing.
Best regards,
Anders
Hello Anders,
Thank you for your feedback.
I have an open discussion with our developer team about this behavior. We will let you know once they find something about this.
Thank you for being so patient.
Best regards,
Érica Poirier
Hello Anders,
A ticket has been submitted to our development team. Even if they have an idea, it's not an easy fix to implement, and may take some time to be resolved.
We will post it here once a fix is available.
Thank you for being so patient.
Best regards,
Érica Poirier
Hi Erica,
Thank you for the update and thanks to all of the team for working on this.
I won this :)
First column is energy impact
CleanShot 2025-12-12 at 10.26.46.png
I won this :)
First column is energy impact
@lukaszbloch
You got yourself a space heater now! Merry early Christmas to you :D
Version 2025.3.8.3.
My MacBook thinks it's a drone and is trying to fly off the desk ;) Seriously, there is something wrong with few latest updates.
Hello
Can you provide a screenshot showing the columns I have configured here?
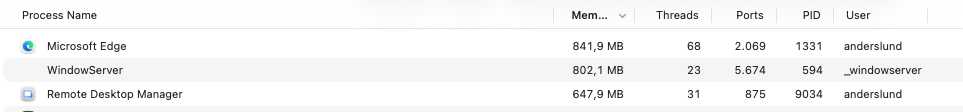
I'd also be interested to see what's in the "Memory" tab for Remote Desktop Manager.
Finally, if you're experiencing high energy usage, select RDM in the list and choose View > Run Spindump. Spindump generation takes some time. You can send the resulting file to me by PM.
Thanks and kind regards,
Richard Markievicz
Screenshot 2025-12-12 at 08.38.19.png
Sorry for polish :)
memory 
CleanShot 2025-12-12 at 14.44.09@2x.png
CleanShot 2025-12-12 at 14.43.04@2x.png
Hello
Just to be really explicit to everyone reading this thread, a spindump is helpful if it's captured at the moment you are experiencing the issue. It takes a snapshot of the state of the process at that exact moment. So, this would need to be done while RDM is idle and showing high energy and/pr CPU usage.
Thanks and kind regards,
Richard Markievicz
Ok but you need to agree that even when I am working with RDM and it is not idle this is too much, right?
CleanShot 2025-12-12 at 15.47.28@2x.png
Hello,
Thank you for your feedback.
Are you using a Mac Intel processor or the Apple M Series processor?
Best regards,
Érica Poirier
Hello
Ok but you need to agree that even when I am working with RDM and it is not idle this is too much, right?
Unfortunately it's extremely hard to say. "Energy Impact" is only very vaguely defined by Apple, no-one has a real understanding of what those numbers mean and the formula used to calculate them. Just that "higher is worse". In old macOS versions that number directly reflected the POWER metric from `top`, but in newer macOS versions it's something completely arbitrary to Apple.
So: we see that energy usage is high, but that alone is fairly meaningless without understanding CPU time, memory usage, network and disk access. "Working" is also pretty arbitrary: that could mean "I have a single RDP session" or "I have 30 tabs open with a mix of web, RDP and terminal sessions".
Unfortunately although we have a few people chiming in here, it does seem like a relatively isolated issue so that points at something specific in a hardware, software or workload configuration.
The original topic was about high energy usage while idle relative to other applications, which is why I've focused on that.
When I look at the spindump you provided, I see the system spending a significant time on text layout operations. These operations are expensive and could definitely cause degraded performance if it's not being done appropriately. But you also wrote that at the time you took the spindump, it seemed quite ok. So what I would need is: "I have these tabs open in RDM, I'm working on this, CPU is and energy usage is quite high, here is a spindump I took at that moment".
A spindump gives insight into what the process is doing, but it's data that's hard to read and interpret; so without the full context it's very hard to come to any conclusion.
Please, let me know if something isn't clear or you have other questions
Kind regards,
Richard Markievicz
I was foolish to restart RDM this morning, as it had high CPU and energy usage with no connections open, but I restarted RDM. I should have made a dump before then. The issue I'm seeing, might be related to having RDM running for a long time, maybe weeks, going though multiple times of the laptop sleep.
Is it possible to downgrade? If I uninstall RDM from the newest version and install an older one, will my locally stored connection database still work?
Same problem here, unworkable.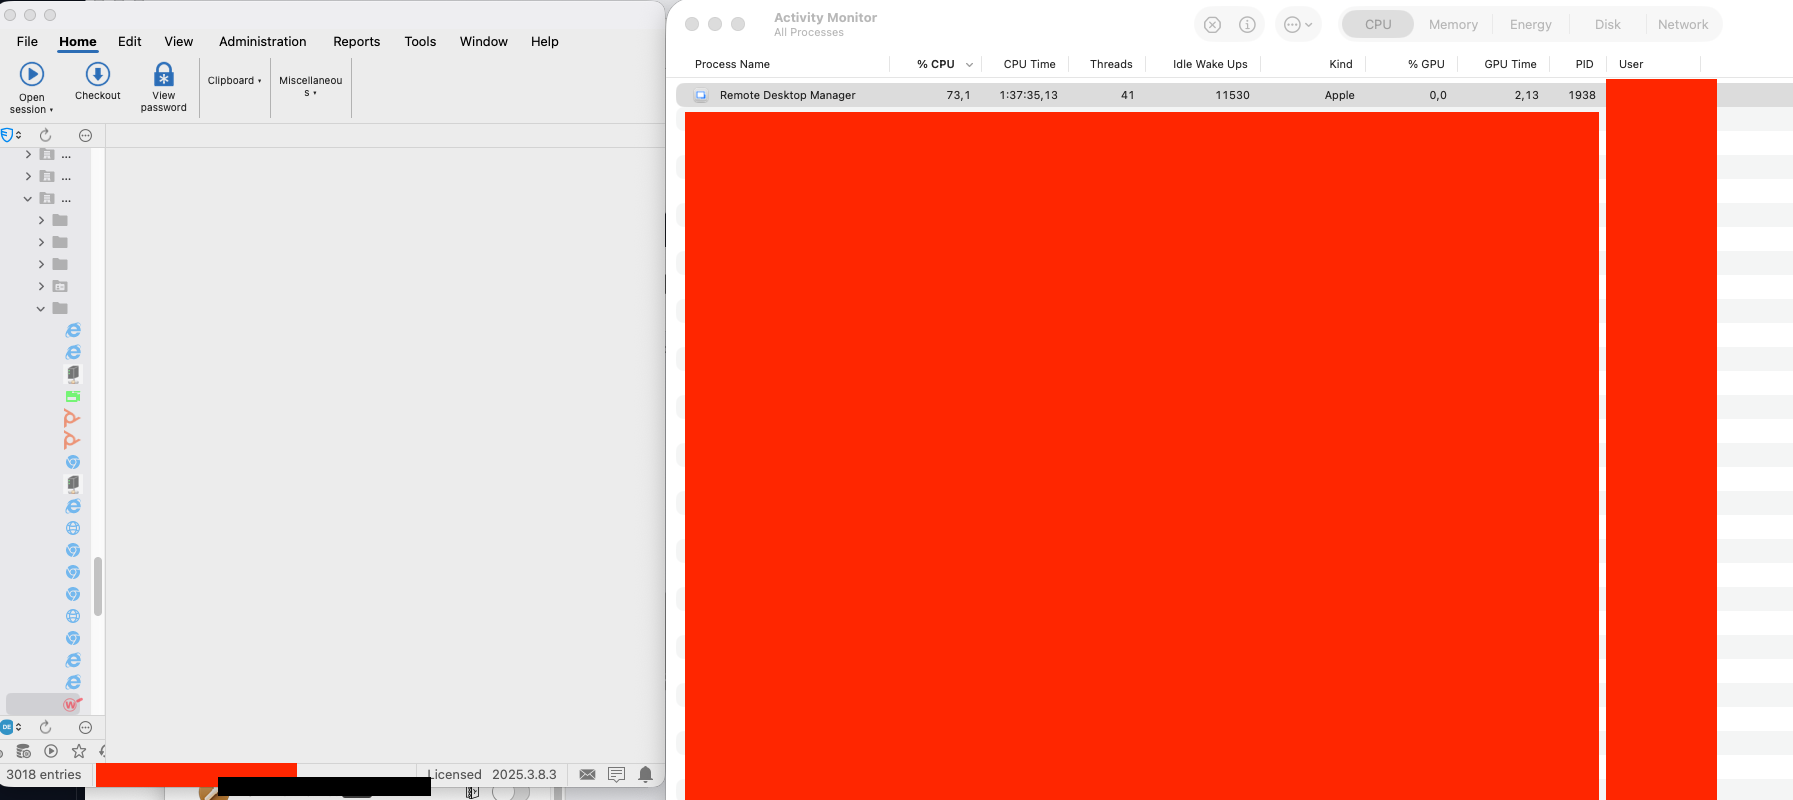
Screenshot 2025-12-15 at 12.30.51.png
Spindump attached.
RDM is open without any active session. Process has CPU usage around 50-55%.
MBP Intel based.
Hello @pawelhoros
Is this shortly after starting RDM, or after it's been running for some time?
Thanks and kind regards
Richard Markievicz
Hello @pawelhoros
Is this shortly after starting RDM, or after it's been running for some time?
Thanks and kind regards
@Richard Markiewicz
Right after startup, the load is increased, then it normalizes at 50-70%. Usually I have two RDP sessions open to computers on the local network and it just sits in the background. Here for testing purposes I disconnected everything and did this spindump after some time.
Here are my info after having RDM running for a few days on a laptop that has been set to sleep a couple of times.
Spindump sent as DM
a76a94da-b032-4bfe-bd65-746ad75a014d.png
a8c74254-591f-4a97-b519-1b66108ac835.png
Hello
Thanks everyone for the extra information.
I'm afraid the spindumps provided don't point to a specific issue on our side, which is not entirely unexpected. Spindumps are useful but often don't provide a complete picture. What I see in every case is work being done internally by .NET (garbage collection and JIT compilation) which alone shouldn't explain high idle CPU usage (at least, not consistently). I can't see from the data we have what is causing high CPU.
It's extremely hard to say what's going on without being able to reproduce on my side. For reference, I'm using an M1 Pro and I do see high CPU usage at application start and for a period shortly afterwards, which is expected. After that the application settles down to a consistent 1-4% idle CPU which I would consider normal. In terms of background work happening; in general there shouldn't be much. RDM starts threads to manage the HTTP browser linker (for our browser extension), background vault and offline data sync. Assuming these threads have no work to do they are effectively idle and I've checked by examining the code that we're "parked" in a safe way - we're waiting for activity to wake us up instead of spinning the CPU. I see very brief bursts of activity up to about 10% CPU while RDM is talking to a remote datasource (DVLS, in my case).
I would consider those to be appropriate baseline numbers and anything significantly higher than that is cause for concern. Also to note that on macOS, the percentage CPU is shown as a percentage of a single CPU core (unlike on Windows where percentages are taken from the CPU as a whole). Since @anderslund1 has a much more powerful machine than me, I'd expect the numbers to be lower.
I would ask the following:
- What data source are you using?
- Please go to Help > Performance Profiling and set the "Profiler Level" to 8388607
- Leave the profiling window open and share the results in a period covering high idle CPU
This will help establish if the high CPU is directly correlated to work that RDM is doing in the background.
If this doesn't yield any firm answers I'm afraid the next step might be to open a support ticket and let us take a look at what is going on. It's hard to provide comprehensive support for this issue over the forum because everyone's environment is so different. It may require using a profiling tool on your machine to capture the specifics of the problem and that's not something I can easily give guidance on through the forum.
In @pawelhoros case, things might be a little more complicated. Since you use Intel, you might be affected by the issue described in this post. To summarize: RDM has started using AvaloniaUI more heavily for it's UI framework. You can read about that here. There is a bug in Avalonia that forces Intel Macs to use their discrete graphics card instead of the integrated one. While the discrete graphics card doesn't directly cause higher CPU usage, it can do so indirectly - the increased temperatures may cause the CPU to throttle. Especially on those late model MacBooks which have notoriously bad thermals. Either way, it will also contribute heavily to increased energy usage.
I've a ticket open with Avalonia to address that, but in the linked thread we had a couple of workarounds. One is to use an older RDM Mac version (2025.2.x). Another is to use gswitch to force the system to stay on integrated graphics. You could try it and let me know if things are noticeably better.
Please, let me know if you have some questions or something isn't clear
Kind regards,
Richard Markievicz
First, thank you for still working on this issue.
I would ask the following:
- What data source are you using?
- Please go to Help > Performance Profiling and set the "Profiler Level" to 8388607
- Leave the profiling window open and share the results in a period covering high idle CPU
Using Azure SQL Database with MFA authentication. I also have a Password Hub connection configured but not using it.
Running the Performance Profilling right now where idle CPU usage is hovering at around 55-70% I will PM you when it has been running for a little while.
If this doesn't yield any firm answers I'm afraid the next step might be to open a support ticket and let us take a look at what is going on. It's hard to provide comprehensive support for this issue over the forum because everyone's environment is so different. It may require using a profiling tool on your machine to capture the specifics of the problem and that's not something I can easily give guidance on through the forum.
You are welcome to create a ticket around my issue - I have no problem running another profiler if that can help you.
Hello @anderslund1
Thanks for sending that through. I don't see anything abnormal in the profiler except for the usual check ins between RDM and the data source.
My supposition is that something about your datasource is causing high GC pressure inside RDM when it synchronizes.
We will need to profile it with .NET trace to understand if that's the case.
I will reach back out next week. Unfortunately as we go into the holidays lots of people are on vacation for the rest of this week so it's a bit harder to coordinate with the support team. I appreciate your patience.
Kind regards,
Richard Markievicz
Just wanted to chime in and say I've been having this exact issue on my M4 MacBook Air for at least a couple months. I started to notice my laptop battery would die much sooner than normal and found that macOS was reporting that RDM was "using significant energy". I've attached an activity monitor screenshot. RDM seems to be crushing CPU and memory. This is with no active sessions running. I'm using just an XML vault. Quitting RDM and reopening returns it to a normal state, but it will eventually go crazy again. I've done this many times, just now looking into what's been going on. It took a spindump but didn't just want to post that here, I can submit it if you let me know how.
Thanks
Screenshot 2025-12-30 at 3.29.24 PM.png
Screenshot 2025-12-30 at 3.30.34 PM.png
Screenshot 2025-12-30 at 3.31.46 PM.png
Same here running 2025.3.8.5 on MacOS 15.7.1 on Intel i9.
Fans start spinning as soos as I run RDM, even with no sessions (local DB).
I have a 3rd party USB charger and when using RDM it discharges faster than it can charge.
Being Idle it takes 200% cpu (from htop), that means two cores running at full speed while doing nothing.
MacOS says it is hogging the laptop:
Unable to use it any more.
a5f192c1-073f-4a25-8fb0-d93b8d96f611.png
My data source is Devolutions Server.(DVLS) When going offline the cpu drops to a normal level.
Hello
Sorry for the radio silence here, we are just coming back from the holiday period.
@anderslund1 and others in this thread, I'm going to work this week on providing further steps that can help us obtain the data needed to troubleshoot this further. It strongly looks like something in your individual environments is causing the .NET GC to run away with CPU time. We're still not able to reproduce this on our side and I need to determine what data we can gather (and how) to progress with this.
@todd1 please send me your spindump, either by PM here on the forum or to service@devolutions.net (mentioning this forum thread).
Thanks for your patience
Kind regards,
Richard Markievicz
spindump sent via PM. Thanks!
Hello
As a next level troubleshooting step, I'd like to gather some information using the dotnet-trace tool. dotnet-trace is a command-line tool used to collection diagnostic and performance traces from .NET applications without requiring a native profiler.
There is some up-front setup required:
- First, you need to install the .NET 9 SDK. The installers are available from Microsoft here. For convenience, here are direct downloads to the installers:
Apple Silicon
Intel
- Open Terminal.app and verify the SDK installation (we want to check that the active SDK is version 9.x to match the runtime used by RDM Mac 2025.3.x)dotnet --info
.NET SDK:
Version: 9.0.305
...
- Staying in Terminal.app, install the dotnet-trace tool:dotnet tool install --global dotnet-trace
- Staying in Terminal.app, verify the installation. The precise version doesn't matter as long as it's 9.x:dotnet-trace --version
9.0.661903+d7b455b46332b31fd9ba3a3f3e020387984c511a
Now we are ready to capture a trace.
Once you reach the situation where RDM is consuming a consistent high idle CPU, open Terminal.app and lookup RDM's process ID:dotnet-trace ps
Example output:
88359 Microsoft.Visua de_modules/@microsoft/visualstudio-code-servicehost.darwin-arm64/Microsoft.VisualStudio.Code.ServiceHost
34896 RemoteDesktopMa /Applications/Remote Desktop Manager.app/Contents/MacOS/RemoteDesktopManager
48672 Rider.Backend /Applications/Rider.app/Contents/lib/ReSharperHost/macos-arm64/Rider.Backend
86514 Rider.Backend /Applications/Rider.app/Contents/lib/ReSharperHost/macos-arm64/Rider.Backend
10395 dotnet /usr/local/share/dotnet/dotnet
46375 dotnet /Applications/Rider.app/Contents/lib/ReSharperHost/macos-arm64/dotnet/dotnet
48698 dotnet /usr/local/share/dotnet/dotnet
48713 dotnet /Applications/Rider.app/Contents/lib/ReSharperHost/macos-arm64/dotnet/dotnet
Identify the ID corresponding to Remote Desktop Manager and use it in the '-p' parameter for the next command:dotnet-trace collect -p 34896 --profile dotnet-common --format NetTrace -o ~/Desktop/rdm-dotnet-common.nettrace --duration 00:01:00
Provider Name Keywords Level Enabled By
Microsoft-Windows-DotNETRuntime 0x000000100003801D Informational(4) --profile
Process : /Applications/Remote Desktop Manager.app/Contents/MacOS/RemoteDesktopManager
Output File : /Users/rmarkiewicz/Desktop/rdm-dotnet-common.nettrace
Trace Duration : 00:00:01:00
[00:00:00:05] Recording trace 568.745 (KB)
Press <Enter> or <Ctrl+C> to exit...
The trace will run for one minute. Once the trace duration is up, it may take up to several minutes for the trace to be written. Please be patient.
Stopping the trace. This may take several minutes depending on the application being traced.
Trace completed.
At this point, you'll have a file on your desktop named "rdm-dotnet-common.nettrace" which you can share with us. Please don't post it publicly, you can send to me via PM or to service@devolutions.net mentioning this forum thread. If the file is too large to attach to the forum or email, again please reach out to service@devolutions.net and they'll be able to provide you a link to upload the file.
The trace captured here will not show us exactly what the CPU is doing, rather what the .NET runtime is doing over time at a low level. It's like runtime activity telemetry rather than CPU monitoring. What it should indicate is if the CPU is coming from GC pressure, allocations or JIT or tiered compilation. However it won't tell us precise CPU sampling information or what lines of code are "hot". So, I'd consider this a first level debugging exercise and it's quite likely that we'll want to refine the trace options based on what we see here. To that end, I'd recommend leaving the tooling installed on your machine.
However, if you want to revert the changes made to your system right now:
- Uninstall dotnet-trace from Terminal.app with dotnet tool uninstall --global dotnet-trace
- Uninstall .NET SDK following the guidance here
- Broadly, the SDK is installed to /usr/local/share/dotnet/sdk and can be deleted with Finder or Terminal
- Microsoft also provides an uninstall tool
As always, if something isn't clear or you need further help with any of the above, please don't hesitate to reach out.
Thanks and kind regards,
Richard Markievicz
I've completed the trace as requested but it's way too big (1 GB) to email or I imagine send via the forums. So if you let me know how you want me to submit it I will. FYI for others, the commands are slightly incorrect. It's not dotnet-trace, it's dotnet trace. At least on my machine.
Todd
Hello @todd1,
Thank you for your feedback.
I sent you a private message with the instructions to send us the file.
Thank you for your collaboration.
Best regards,
Érica Poirier
Hi @todd1
dotnet-trace is the conventional form for the global tool; dotnet trace invokes dotnet as the CLI driver and asks it to execute the trace tool. On my machine both forms work, so I'm surprised if dotnet-trace didn't on your side.
Still, I'm eager to view your results; a 1GB file is surprising for a 1 minute trace. Hopefully there are some answers within.
Thanks and kind regards,
Richard Markievicz
Trace uploaded. Yeah that's odd about the differences in the trace command, but dotnet-trace definitely gives me a "command not found" error on my machine for some reason.
Hi @todd1
I'm just running an initial analysis and the results look really interesting, I need to investigate more before coming to any conclusion but can you confirm RDM was idle when you ran the trace? Were any sessions open? Had the application been running for some time?
Thanks and kind regards,
Richard Markievicz
Glad there's something of value in there! If by "idle" you mean I wasn't actively interacting with it then, yes, it was just sitting there and I wasn't using it. I did have a couple RDP sessions open I believe (I killed RDM and re-opened after the trace finished). But I'm almost positive I've seen cases where even without a single session running it was still going wild. I can't confirm if I've ever seen it misbehave without first having at least one session open. I can't say for certain how long RDM had been open at the time of the trace, at least several hours, but likely even overnight and through a system sleep as that's my typical use. It's unlikely it was running for more than 1 day as the high resource usage happens daily pretty consistently so I'm frequently killing it and re-opening.
Hi @todd1
I have a good lead here, can I ask you to try one more thing for me?
Please enable session logging as described in this KB article and connect to an RDP session (any session, it doesn't matter). Then share the log file with me (you can just send as a PM on the forum). Afterwards disable session logging, it impacts performance (something we clearly don't want to make any worse!).
Thanks and kind regards,
Richard Markievicz
@Richard Markiewicz OK I've enabled session logging but so far RDM is still behaving so I'll keep an eye on it. I assume you only want the session logs from when RDM is going wild?
Hi @todd1
No - any session, regardless of what RDM is doing performance wise. There should be an error logged that I'm interested in.
Thanks and kind regards,
Richard Markievicz
PM sent with session log @Richard Markiewicz
Hi @Richard Markiewicz,
I have DM'ed a .Net trace. RDM was open with no sessions open at the time of the trace. It was using around 40% CPU but now it has gone up to 140%. Have been open for days.
Also DM'ed a session log where I have no sessions open, open a RDP session and closed the session again.
@todd1 Thank you for the heads up on the dotnet-trace / dotnet trace
Kind regards,
Anders
Hello
Thank you @todd1 and @anderslund1 for providing the debugging information. I have a clear idea of the problem and we're working on this as a high priority. I will be back in this thread with an analysis and update for release once this fix is integrated.
Thanks again and kind regards,
Richard Markievicz
Hello again
Thank you all for your patience.
Based on what I discovered in the trace information from @anderslund1 and @todd1 this issue should be fixed in RDMM 2025.3.9.1. My colleagues on the RDM Mac team delayed the build to allow the fix to be integrated as a high-priority. That version should be built tomorrow and assuming all is well with QA, released in the coming week. I'm afraid in the meantime I don't have a workaround for the problem other than to restart RDM when it's consuming excessive idle CPU.
For this specific issue: we'd made changes to support upcoming features in Devolutions Agent. For RDP connections, RDM will try to connect to a local named pipe server for each RDP connection. That server will only exist if Devolutions Agent is installed on the RDP server. In the failure case, nothing should happen and on Windows we see that the underlying .NET API calls WaitNamedPipe, parking the thread and effectively consuming zero resources. However it transpires that the implementation on .NET for Unix systems is different; it polls in a busy loop causing excessive CPU usage. To compound the problem, it generates exceptions at an extremely high rate causing an exception storm on the system and further degrading performance. After investigating I found that .NET was generating exceptions at a rate of about 1000/second which is beyond anything I've ever seen.
So - this was a bug in RDM, but it was manifested by unexpected (and inconsistent) behaviour on the .NET side. Since this is a long established behaviour on the .NET side, it's unlikely they'll change it to avoid backward compatibility issues.
I've worked around the problem on our side and, as I wrote, that fix will be available in 2025.9.3.1.
After updating, if you still experience high idle CPU or energy usage I'd encourage you to report back in this thread. For reference; on my M1 Pro system RDM has a baseline idle CPU of 1-4%. Periodic spikes are expected even when idle, particularly when using a shared data source, as synchronization and cache maintenance are handled in the background on approximately a 30 second interval.
For users on Intel systems, energy usage may remain higher than expected even if average CPU load is low. As I've written above, you might be affected by the issue described in this post. To summarize: RDM has started using AvaloniaUI more heavily for it's UI framework. You can read about that here. There is a bug in Avalonia that forces Intel Macs to use their discrete graphics card instead of the integrated one which can cause much higher energy usage.
I've a ticket open with Avalonia to address that, but in the linked thread we had a couple of workarounds. One is to use an older RDM Mac version (2025.2.x). Another is to use gswitch to force the system to stay on integrated graphics. A final recommendation is - if your Mac has USB-C / Thunderbolt charging - charge your machine using the ports on the right hand side. There is a known issue on late model Intel laptops where charging on the left-side ports causes thermal runaway. This will compound the issue of using discrete graphics, cause the system to throttle the CPU accordingly and significantly degrade overall and thermal performance.
If you believe you're affected by this, I've added an option for the 2026.1 release which will allow forcing the system into software rendering mode. I'm not sure if the results will be better or not but it is something that we're working on.
As always, please don't hesitate to reach out with further questions or comments
Kind regards,
Richard Markievicz
@Richard Markiewicz Excellent work tracking this down so quickly, and I (and I'm sure the others on this thread) appreciate you all squeezing this fix into the next release. I'll be sure to try it when it's available.
Thanks again!
Agree with todd1, I really appreciate the work you put into fixing these things. I know it might not be the coolest thing to go bug hunting (I work in a software company myself, not a developer though) but it only confirms our choice of using Devolution products. Love the detailed explaination of the issue. I'm looking forward to the new build.
Hi,
When will the RDMM version 2025.3.9.1 be available for download?
Will it be available through the official upgrade path or will we need to download a beta build?
Regards,
Lukasz
Hello,
The 2025.3.9.1 version that includes the fix for this issue is expected to be released this week.
Sorry for the confusion earlier I was referring to the 2026.1 version, which is currently planned for release around March.
Thank you for your patience, and please don’t hesitate to reach out if you have any other questions.
Best regards,
Carl Marien
Hello,
RDM Mac 2025.3.9.2 is available and should have fixed the energy issues.
As usual if there's anything, don't hesitate to communicate with us.
To answer your question @lukaszbloch it's available following the official upgrade path.
Best regards,
Michel Lambert
@Michel Lambert Thanks for the update.
I installed it yesterday and so far everything looks good 🙂
I have installed the new version and will be monitoring the resource usage when it have been running for a while.
Thank you!
So far it's much better. However, I'm still a little surprised about the 3-4% idle CPU usage. I have no other apps that uses this much at doing nothing, including Teams that comes in at 2-3%
I've been running the new version since the moment in came out and so far the energy issue has been solved, thanks! I do notice the same 3-4% idle CPU that @anderslund1 mentions without even having any sessions connected. This is consistently the highest in my process list. If I quit RDM and reopen without connecting any sessions it returns to that 3-4% baseline. I'm PM'd a new dot net trace in case you want to investigate.
Hello
First of all, thanks for the positive feedback and I'm glad we were able to resolve the general CPU leakage issue. I do apologize for the inconvenience caused by that.
So, when I look at this on one hand: CPU usage in activity monitor is per-CPU, so a 4% usage on my M1 Pro is 4% of a single core. That's a 10-core CPU so overall load on the system from the application is something around 0.5%. I don't consider it very high.
When I look at it on the other hand, I understand that there are users on lower-powered systems (especially Intel, which still makes up a portion of our user base) and that effect will be more pronounced. I also firmly believe that we should try to be the best we can here, and good citizens on the OS use the absolute minimum idle power as possible. So I agree that we can and should try to optimize further.
@todd1 I appreciate you being proactive and sending the nettrace file, however it doesn't tell me much. The trace parameters were tuned to catch specific conditions and honestly we actually got quite lucky that it identified the original issue on the first shot. I had expected that we'd need to iterate on that. However, this morning I went through in the debugger and did some targeted tracing on my side and looked at what RDM was actually doing in the background.
When I run through the code base and aggressively turn off background work, I'm able to get idle CPU down to ~0.8% (between 0.5% and 1.1% consistently). That would be considered the absolute baseline minimum as the remaining work being done is rendering.
Is that a realistic goal? Probably not because RDM isn't just doing busy work in the background. However just from a quick pass this morning I have identified several areas that we can optimize; some of them are quite low-hanging and others are a bit more involved. I'm going to take my findings to the RDM team and open some improvement tickets that I'll link to this thread, and you can be notified as we try to bring performance up. I'm confident we can at least be on par with MS Teams as @anderslund1 pointed out at 1.5-3% idle. Some of that will depend on the data source as background sync for a shared data source is obviously more costly than a local data source which doesn't need background work to be consistent.
As always, if something isn't clear or you have further questions please don't hesitate to reach out
Kind regards,
Richard Markievicz
Hello again
I've pulled on this issue a bit more this morning and found one high frequency timer that I was able to replace with macOS intrinsic functions. The result on my machine (and your mileage may vary here, depending on your hardware and workload) is an idle CPU of around 1% (down from 4%).
That change is integrated, unfortunately I think it missed the build for 2025.3.10 but it should be on any subsequent 2025.3.x releases and of course 2026.1.
I also made another optimization to two key work timers; that seems good for (again, on my machine) about a 0.1% idle CPU saving but it should have a higher impact on energy usage (we're allowing the system to coalesce these timers against other work on the system).
Again, that fix will follow the same timeline.
At that point I think unless we can identify other large CPU or power drains, any further work would just be micro-optimization. However I'll be eager to hear your feedback, but I'm afraid you'll need to wait for 2025.3.11 (or higher) or 2026.1 (March).
Please, let me know if something isn't clear or you have further questions
Kind regards,
Richard Markievicz
@Richard Markiewicz your efforts here are commendable. You just don't see this kind of customer service anywhere anymore, I really appreciate it. If anyone from management is reading, give Richard a raise :)
@Richard Markiewicz Thank you for looking into my minor annoyances and very cool that you found some things that could be optimised <3 I know this is on the low end but it really sticks out to me when something is off like this. :-D