RDP on MacBook Pro (Silicon) using over 3GB of memory.

Hi,
New macbook pro m4 pro and having only one RDP connection opened, but for 3days, RDM is using 3.5GB of ram. Connection is opened to a LAN PC, and not even focused on the tab (using it for OTP codes mostly).
Closing the RDP session does not free up the ram.
(also, a bunch of about: processes that exits if application is closed)


Version: 2025.3.6.9
Thank you.
Screenshot 2025-10-29 at 03.59.03.png
Screenshot 2025-10-29 at 03.57.55.png
Screenshot 2025-10-29 at 03.57.14.png
All Comments (31)
Hello,
Thank you for reaching out to us regarding this matter.
Could you please confirm the type of RDP in use? For example, is it FreeRDP?
In the meantime, could you also check if there is any device or system currently enabled or associated with this entry?
Best regards,
Tommy Sanders
Hello,
Thank you for reaching out to us regarding this matter.
Could you please confirm the type of RDP in use? For example, is it FreeRDP?
In the meantime, could you also check if there is any device or system currently enabled or associated with this entry?
Best regards,
@Tommy Sanders
Hi, using it only in tabbed/embedded mode - If I was to using it detached, I have the Microsoft app for that so not sure who would use RDM to open sessions same as you do with the MS app :)
Hello,
Thank you for your response.
I will run some tests tomorrow and will follow up with you shortly afterward.
Best regards,
Tommy Sanders
Hi, just an update - now on 2025.3.9.2 - no change, leaving the app opened for 1-2 days and it still grows over 3GB :(
Since the last report, ram is now more expensive than gold :)
Screenshot 2026-02-07 at 02.05.20.png

Here’s how to show “Real Memory” in that view (macOS Activity Monitor style list):
- Open the window with the process list (where you see Process Name / Memory / Threads / Ports).
- Move your mouse to the column header row (the bar that says Process Name, Memory, etc.).
- Right-click (or Control-click) directly on that header row.
- In the menu that pops up, find and check “Real Memory”.
I'm whatever Gotham needs me to be.
Screenshot 2026-02-06 at 20.59.45.png
Hello @iustinn
Thank you for your patience.
Could you please let me know whether RDM, when idle after a reboot, shows the same level of resource usage? Additionally, can you confirm whether you had multiple sessions open before reviewing the Activity Monitor?
Could you also please confirm the following:
The specifications of your machine
Your typical usage pattern with RDM (for example: the types of sessions you mainly use, whether you have many long-lived sessions, frequently open and close sessions, or typically keep the application running for extended periods)
I look forward to your reply.
Best regards,
Tommy Sanders
Don't know if new topic is needed since 6mo has passed, an I have been away from tech, but there must be something wrong.
Now I have the same thing on a new macbook pro (m4pro), with RDM over 11GB of ram used over 6days, and only 1 constantly active RDP session.
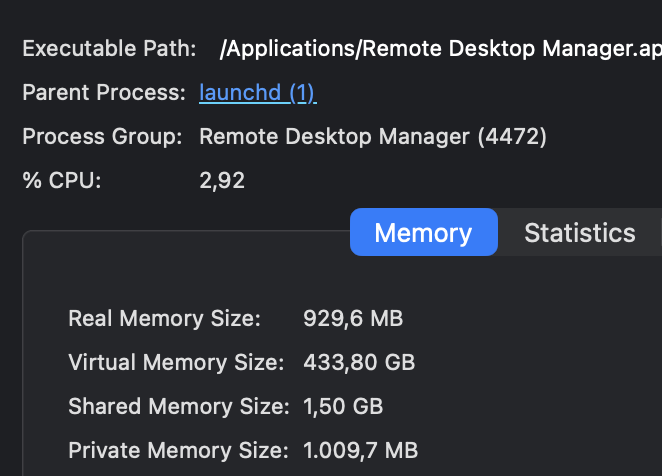
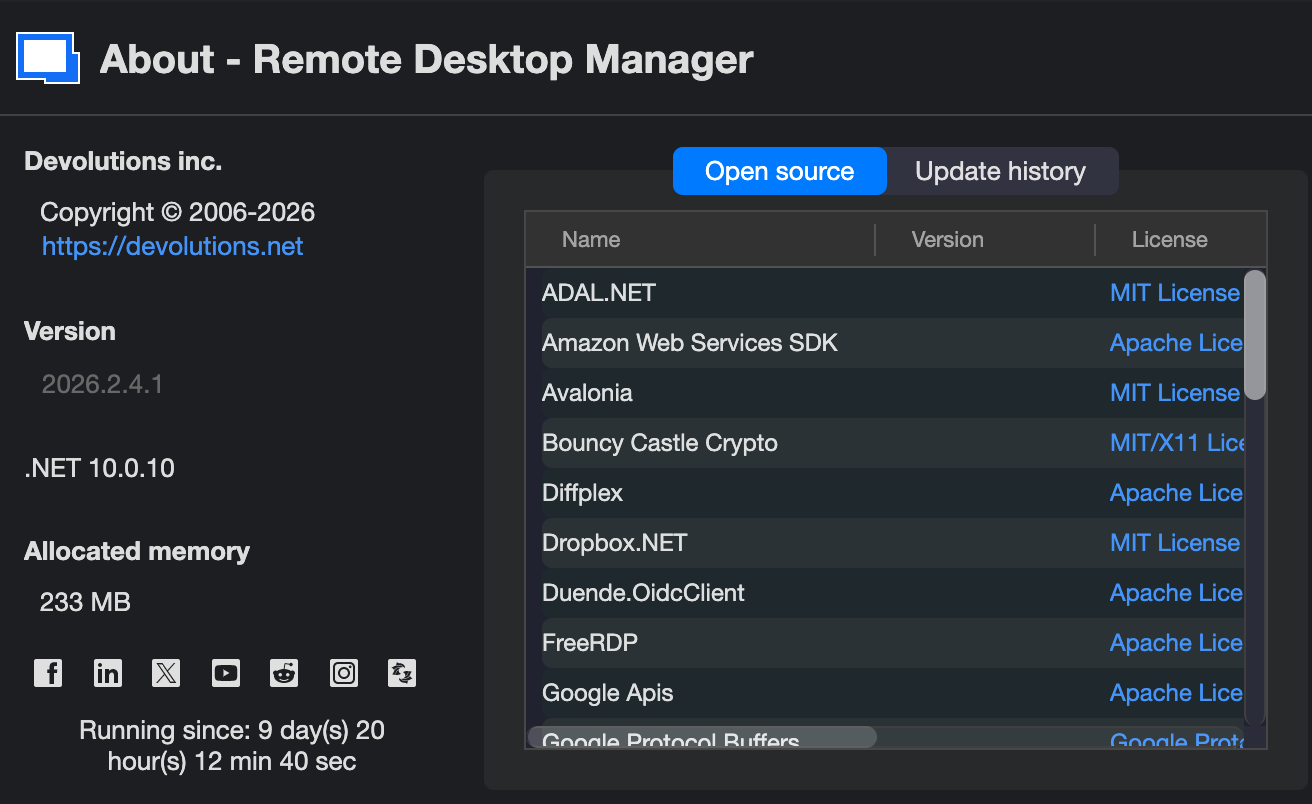
Also, some captures of the RDP options used for this one Windows 11 remote session.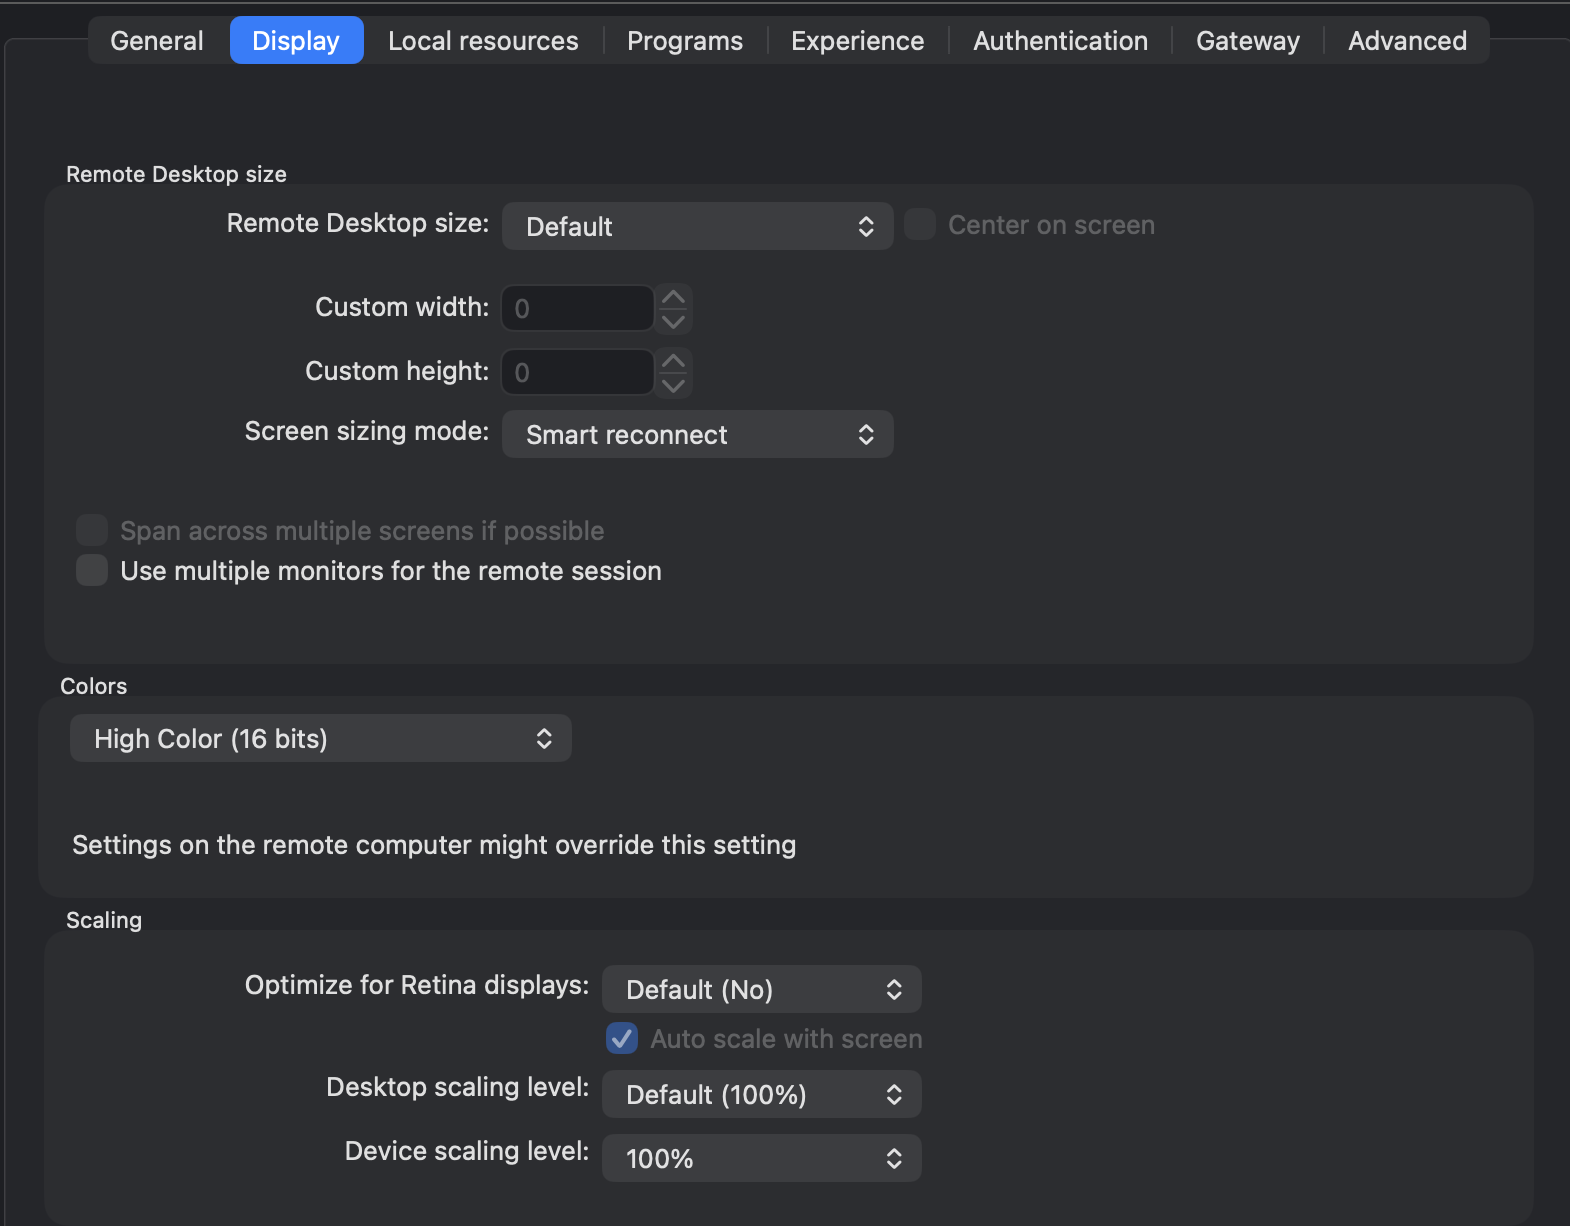
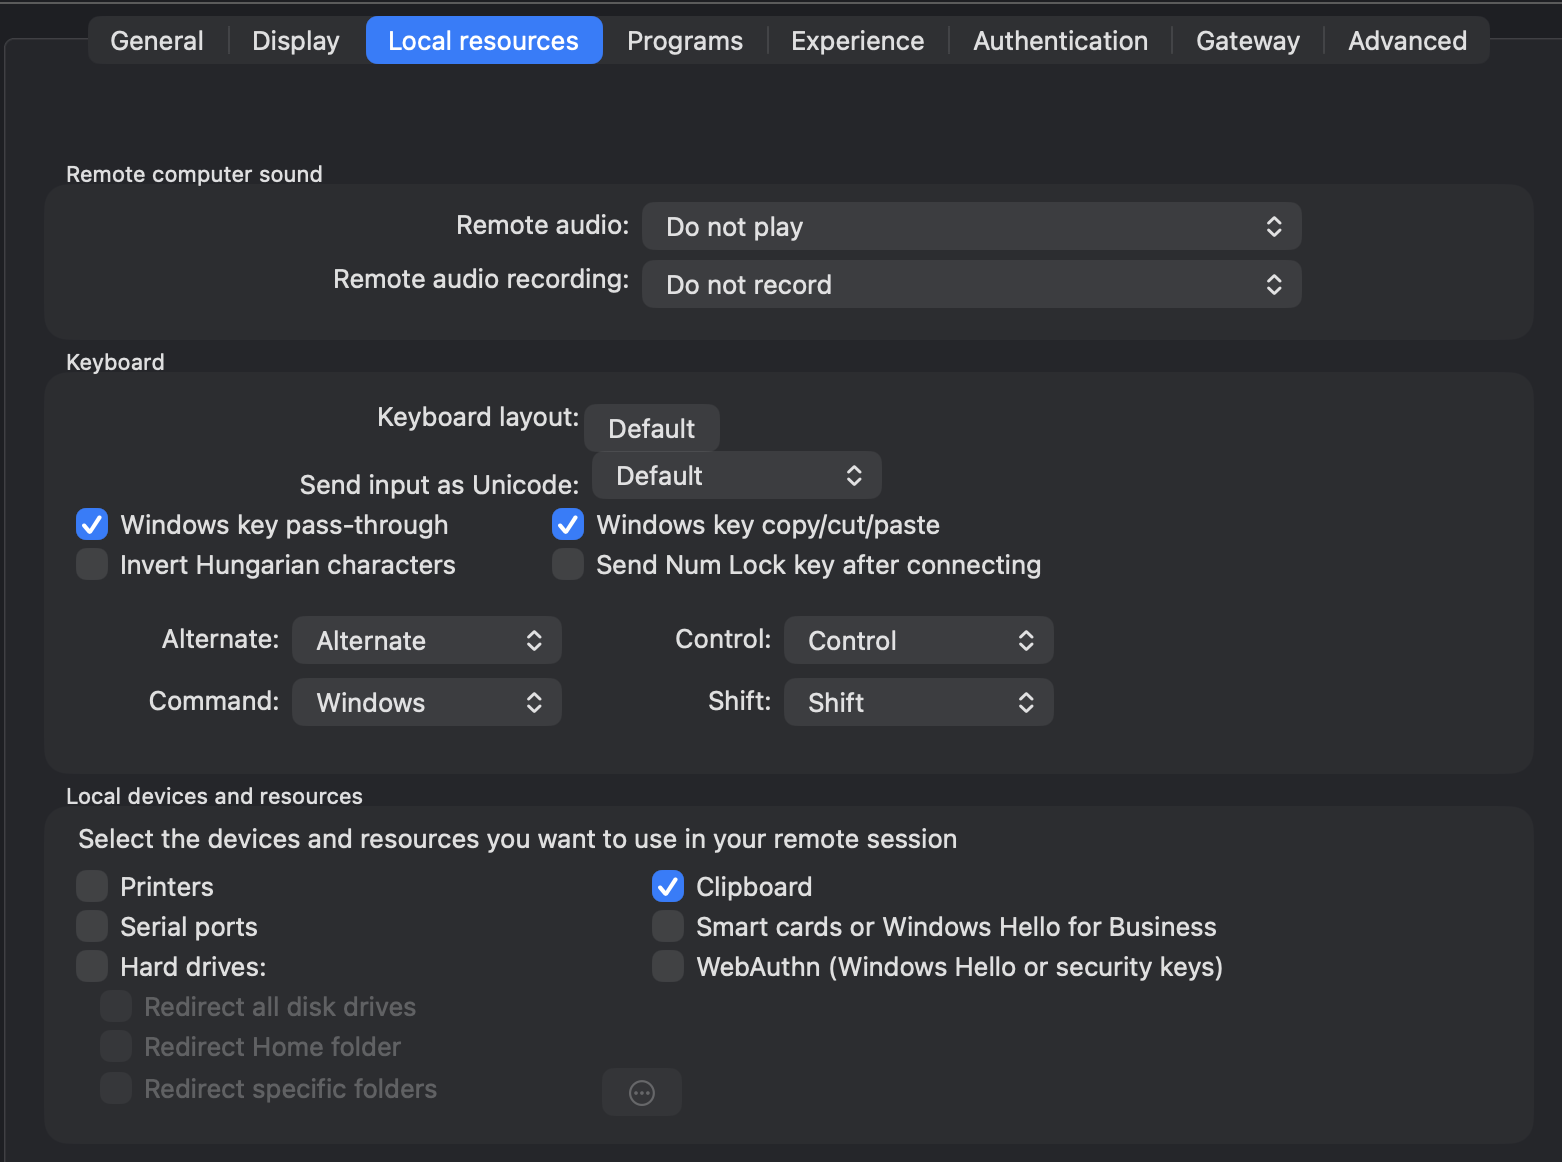
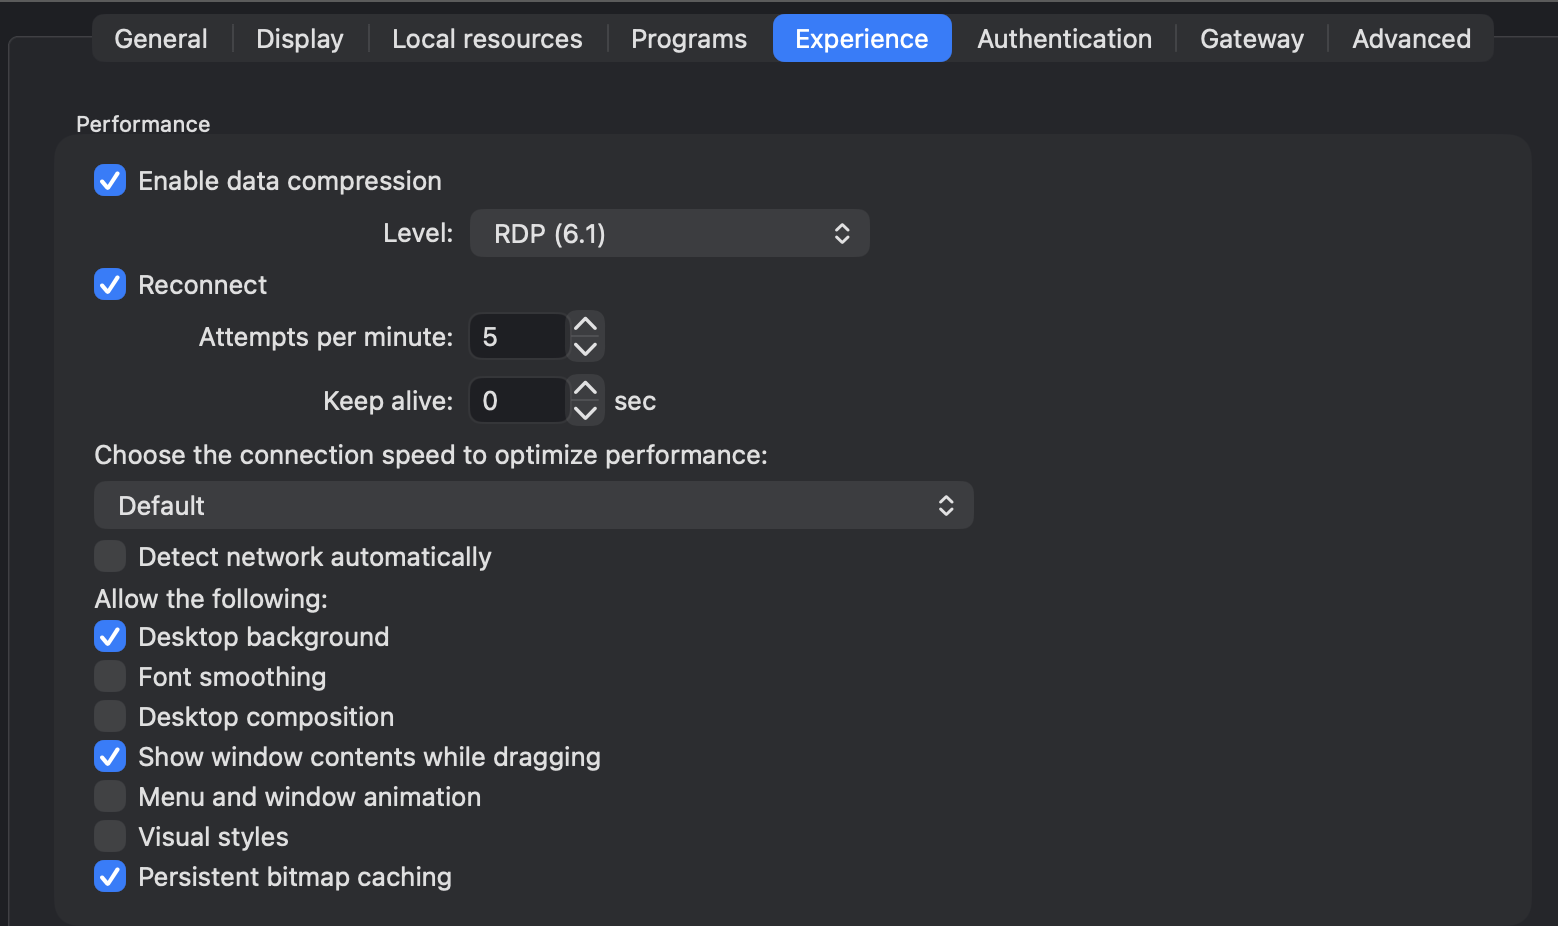
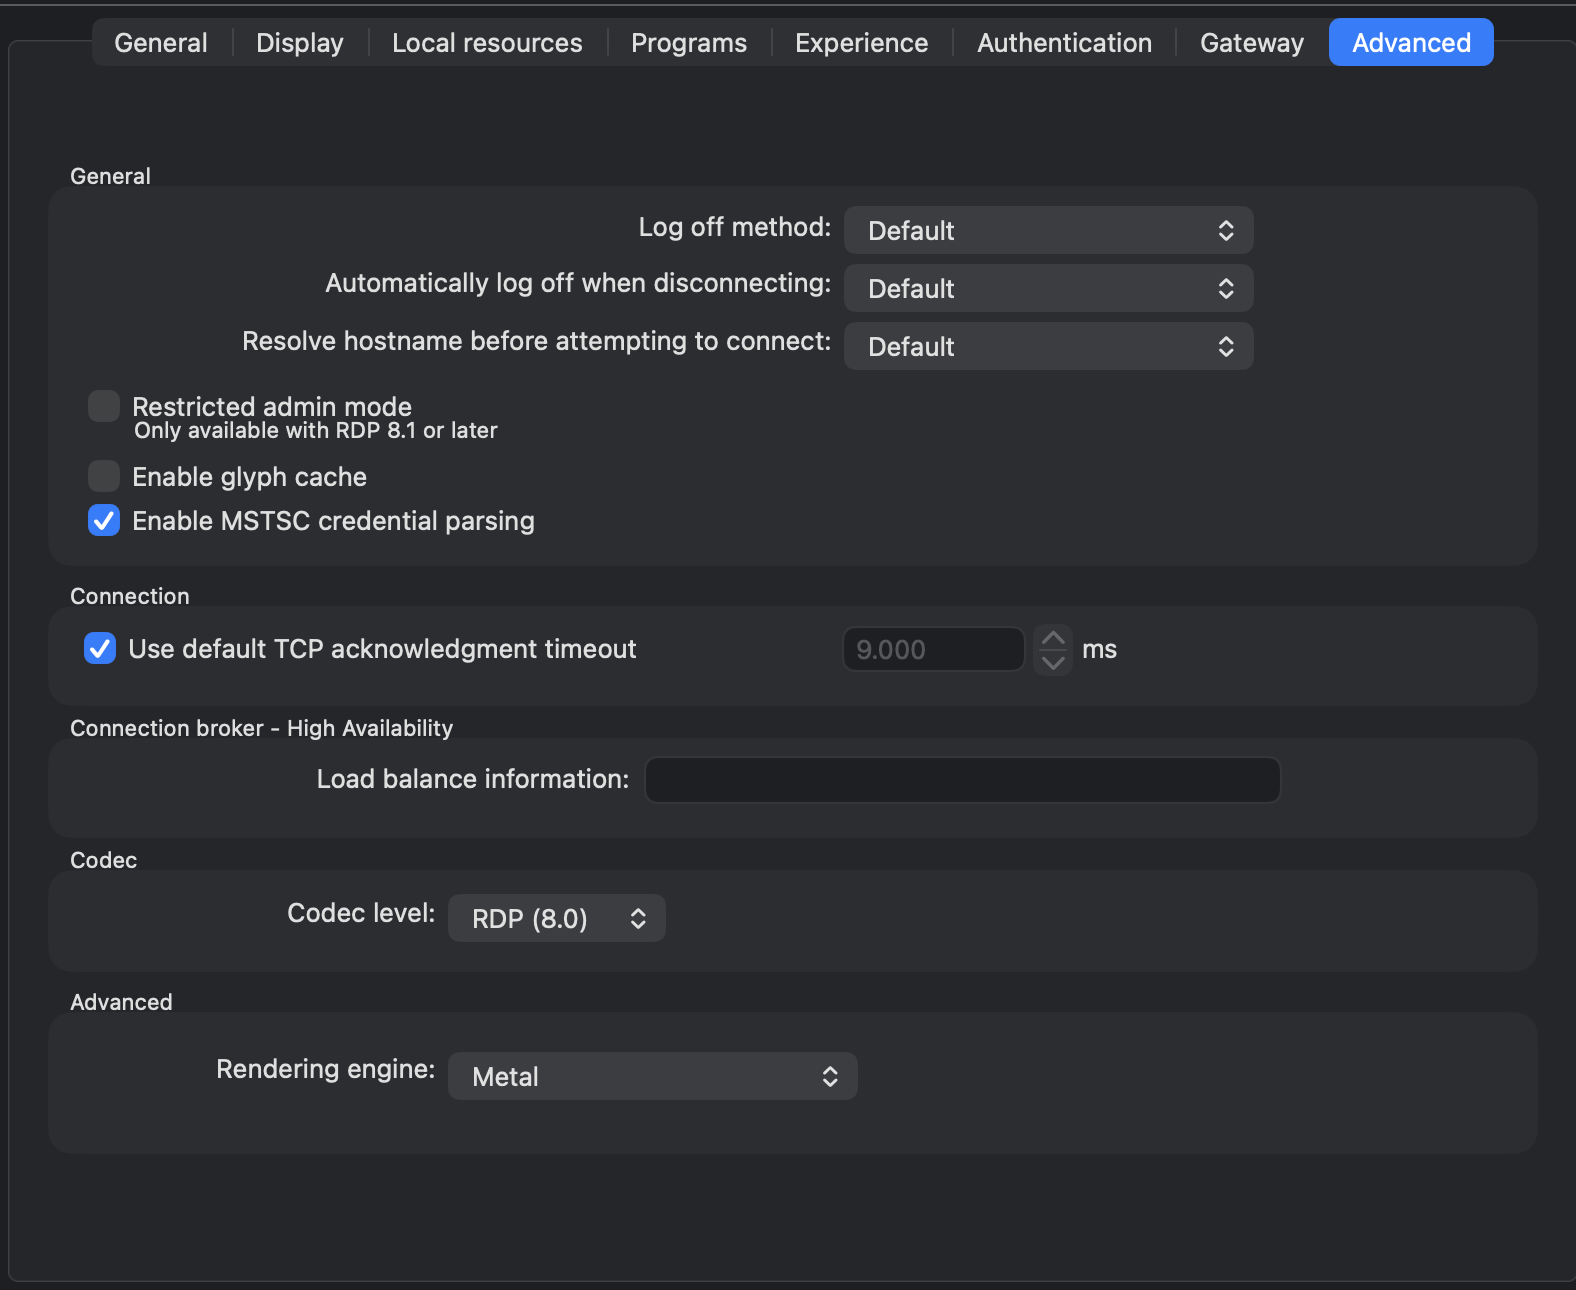
As always, thank you for your time, it is just frustrating this issue still persists after some years :(
Screenshot 2026-08-02 at 22.53.39.png
Screenshot 2026-08-02 at 22.53.30.png
Screenshot 2026-08-02 at 22.53.21.png
Screenshot 2026-08-02 at 22.53.11.png
Screenshot 2026-08-02 at 22.52.36.png
Screenshot 2026-08-02 at 22.52.10.png
Screenshot 2026-08-02 at 22.51.13.png
And after some AI assisted investigation we have the following:
While the affected RDP session was open, vmmap reported a 12.0 GB RDM footprint, including 10.8 GB of IOSurface allocations across 1,293 regions.
I closed the RDP session but left RDM running. Immediately afterward and again several minutes later, the footprint remained 11.8–12.0 GB, with approximately 10 GB retained across 1,277 IOSurface regions.
Therefore, closing the RDP session released only 16 IOSurface regions and did not release the approximately 10 GB accumulated graphics-buffer footprint. The memory is released only when RDM terminates.
This appears to be retained IOSurface/Metal resources in the main RemoteDesktopManager process rather than a .NET managed-memory leak.
That is strong, developer-actionable evidence of an RDP/Metal resource leak.
Hello
A few low-hanging things that would help get into the problem:
- You said a "constantly active" RDP session. Did you have the same RDP session open for the full 6 days, or were you opening and closing sessions but only generally keeping one open at a time?
- In the application settings, under "Types > Remote Desktop (RDP) > Advanced", so you have "Use unified memory" enabled? If so, please try disabling it. This is the only place in the embedded RDP that will manually allocate IOSurfaces and is not really needed anyway in the more recent RDM versions.
- Otherwise, can you try (temporarily) switching the "Rendering Engine" (in the "Advanced" tab of a specific session, or change the global default in the same spot as above) to Core Graphics? I'd steer clear of OpenGL which is still Metal underneath. It's likely that Metal de/allocates IOSurfaces itself, and if the problem goes away when using Core Graphics it would point to a problem in our intermediate usage of Metal.
- Do you think it's related to RDP? You said you had one RDP session constantly, but are you using any other features of the application? Any other session types?
Please, let me know if you have some questions or something is not clear
Thanks and kind regards,
Richard Markievicz
Hi, thanks for reply.
- yes, same RDP session opened for 6 consecutive days, without reconnects.
- unified memory disabled (was never enabled before)
- I only use RDP (90%) and occasionally some SSH into some Proxmox box.
(I do also use some OTP credentials when I don't have my mobile near me, but during those 6 days I don't think so.)
I will now change the rendering engine, restart, wait and report back.
It is clear to me that the ram grows by the day. Restarted yesterday, only one RDP session and I am at 4+ GB already..
And I think it matters what is on the remote box, because normally I does not grow to 4 gb/day, but now I configured some remote cctv cameras in that windows box and it showed live video, so somehow makes sense to me that if the graphics are 'kept', it grows faster if viewing a movie vs. text in a notepad, but it's just speculation...
Observations:
(engine changed to core graphics)
- cold start and opened 1x RDP session = 1GB
- 1.5 GB after 1 hour
- next morning, it is at 3.18 GB
- now (15pm) already at 5+GB
So changing the rendering engine did not help.
Current capture after 18h10m:
- Total RDM footprint: 5,048 MB
- IOSurface: 3,915 MB across 940 regions
- IOAccelerator (graphics): 232 MB
- Ordinary malloc memory: comparatively small
- Unified memory: disabled
"The accumulating memory remains overwhelmingly IOSurface memory, suggesting the retention occurs in renderer-independent RDP display/surface handling, or in a path shared by both rendering engines—not specifically in the Metal renderer"
Hello again
Thanks for the information. It is certainly confusing, since without the unified memory option we're not directly allocating IOSurfaces ourselves (neither in RDM or within the RDP library). Additionally, using the Core Graphics renderer should bypass Metal entirely.
Do you have the OpenH264 decoder enabled? It's in the application settings, Types > Remote Desktop (RDP) > Codec.
is it possible to try and rule out RDP here? What happens if you cold start RDM at the end of your day; without running a session or anything else; if you come back to it the next morning is memory usage normal?
Thanks and kind regards,
Richard Markievicz
Hello again
Thanks for the information. It is certainly confusing, since without the unified memory option we're not directly allocating IOSurfaces ourselves (neither in RDM or within the RDP library). Additionally, using the Core Graphics renderer should bypass Metal entirely.
Do you have the OpenH264 decoder enabled? It's in the application settings, Types > Remote Desktop (RDP) > Codec.
is it possible to try and rule out RDP here? What happens if you cold start RDM at the end of your day; without running a session or anything else; if you come back to it the next morning is memory usage normal?
Thanks and kind regards,
@Richard Markiewicz
OpenH264 decoding is disabled.
I will perform the proposed idle-control test:
- Fully quit RDM to release the existing IOSurface allocation.
- Cold-start RDM with no RDP, SSH, or other sessions opened.
- Record the initial memory footprint.
- Leave RDM idle overnight.
- Record the footprint and allocation categories again the following morning.
I completed the idle-control test with OpenH264 disabled.
RDM was cold-started and left idle for 20 hours 20 minutes without opening any RDP, SSH, or other sessions.
- Initial footprint: 571.6 MB
- Final footprint: 662.5 MB
- Initial IOSurface: 39.1 MB across 729 regions
- Final IOSurface: 39.0 MB across 722 regions
- Peak footprint remained unchanged at 904.3 MB
Therefore, idle RDM does not exhibit the multi-gigabyte IOSurface growth. The growth is triggered by an active RDP session, occurs with both Metal and Core Graphics, with unified memory and OpenH264 both disabled.
Hello
Thanks for that. There are more diagnostics we can run. but this is likely to be a slow and frustrating process to do by proxy, especially without regular debugging tools. It would be ideal if we can narrow down exactly why this is occurring on your side. It's not a known (or at least common) problem as far as I can tell, and a review of the rendering code paths doesn't reveal a problem (but that's also maybe irrelevant, since you got the same results with both Metal and Core Graphics).
I'd like to understand the environment a bit better.
Is it just one server you're RDP'ing to generally? Your sessions are long but are you generally interacting with the server? Is it usually in the foreground, or background/minimized? Any 3rd party software running on that machine that you're using that might be interesting (you mention streaming CCTV cameras)? What's the server OS version?
It may seem like an unnecessary probe but RDP supports many different codecs, all with their own decode path; and it can use and interleave different codecs within one session (different parts of the screen are drawn with different codecs). There are other things I can think of too: a third party application generating cursor updates in an unexpected way, exposing a leak (perhaps) in how we handle custom cursors.
What about on the RDM side; what local devices and resources are you forwarding? Do you use the thumbnails view, and are you screen recording your sessions (either within or without RDM)?
Any extra details might be help
Thanks and kind regards,
Richard Markievicz
Hello,
I connect to various Windows 10 and 11 machines, not Windows Server. The behavior isn’t tied to a particular remote computer.
There is no CCTV, video, animated dashboard or other unusual workload involved, this was just this time, I do various things. It can happen with a plain desktop and ordinary administrative use. The session moves between foreground, behind other applications and occasionally minimized.
I don’t use thumbnail view or session recording. Resource forwarding is limited to the clipboard.
One potentially relevant setting is Persistent bitmap caching, which is enabled. I can test with that disabled if useful.
I’ve experienced the same behavior over the years on a 2019 Intel MacBook Pro and two M4 Pro MacBook Pros.
Thanks.
I just had time to try and help, I don't use it say professionally, mostly home/lab use, RDP into proxmox lab, home laptops, ssh here and there and OTP when I don't have the mobile.
It has been like this for a long time, just that I can live with it and did not have time to complain + it is hard to complain about something you use at home for free :)
But, now that we are here, I can run some tests if you want, my AI palls are also happy to help and eat my tokens, and since I used this software for so many years, maybe it helps someone else.
It is hard to think it is only me - if that would be the case - I would not even bother tbh. But all this time, multiple macs, multiple versions of RDM and same issue ?
I don't do exotic stuff on these machines, ... don't know, can't think of anything that would do this to RDM.
Maybe some observation, the more ram I have , the bigger the usage - like this is the first time I see RDM at 11+ GB, but I also have 48 gigs for the first time...
If you want me to provide something that might help, just ask.
Hello
Thanks for the info. I'm in agreement with you that this needs chasing down. Although the extra information you provided makes things rather more confusing in some ways.
the more ram I have , the bigger the usage
I feel like this is important because on a machine with less memory pressure, memory is reclaimed far less frequently. That being said, I have 32GB and I'm unable to reproduce anything close you. My machine generally runs with high memory pressure, though.
On the flip side, I feel like a long-time home lab user who keeps track over multiple machines and RDM versions is likely to give better data than most paid support cases produce.
Let's start with this. After cold-starting RDM and launching an RDP session, run footprint (it needs sudo) and put the results in a file. You'll need RDMs process ID:sudo footprint -p <pid> > ~/rdm-footprint-T0.txt
Two captures are important because we want to be able to filter baseline stuff. So once your memory usage is well up, run the command again and output to a different filesudo footprint -p <pid> > ~/rdm-footprint-T1.txt
And then share the files with me. There's nothing secret in there, but feel free to send by PM if you prefer (you may need to zip the files to attach them).footprint is ledger based, versus vmmap which walks the address space. I want to vindicate what vmmap told you
After the second command, you could also run (again you need to slot in the PID):top -l 1 -pid <pid> -stats pid,mem,rsize,rprvt,vprvt,cmprs,purg
Which will directly show compressed versus purgeable memory.
Please, let me know if you have any questions and thanks again
Kind regards,
Richard Markievicz
Hello,
I completed the requested captures and attached them.
Both captures are from the same RDM process and continuously connected RDP session. T0 was taken 52 seconds after launch; T1 was taken 22 hours 38 minutes later.
The footprint increased from 910 MB to 3,864 MB. IOSurface increased from 113 MB to 2,575 MB.
The session used Metal, with unified memory and OpenH264 disabled.
Some observation: I use tabbed sessions, resizing the left pane triggers the 'reconnect' and memory usage goes up 200-400mb, then it drops some but not all.
rdm-metal-T0-T1-2026-08-10.zip
Hi @iustinn
Thanks, I think we're on the money here - with your data I have found a pretty good memory leak. I'm not 100% it's the same problem you're seeing because it's quite hard to exactly reproduce these things precisely. There's also the problem that we expect the .NET garbage collector to save us for certain kinds of bugs, but it's non-deterministic (which might relate to your "bigger memory" == "bigger leaks" statements earlier) and memory pressure on my machine is typically somewhere in the middle to high. It's also tricky where we are holding managed (.NET references) to native resources (like Metal resources): the reference on our side might be really small (a few KB) but it could point to something much larger on the native side and the garbage collector has no awareness of that.
So, all that to say a key part of your reply combined with the terminal output is "resizing the left pane triggers the 'reconnect'". You are using the "Smart Reconnect" option in the Display settings of the RDP session(s) - you had that shown in your screenshots earlier but I didn't catch it, so apologies for that. This might be why this didn't really come up before; smart resize is not really commonly used anymore. I will absolutely address the issues I've found but is there a reason to not use "Dynamic Resolution" instead? The experience should be much smoother and more seamless and is supported by virtually any semi-modern Windows RDP server. I expect this setting to not exhibit the issue. Note that you also need to specify the remote desktop size as "Default" - pinning a fixed size will prevent this option from working.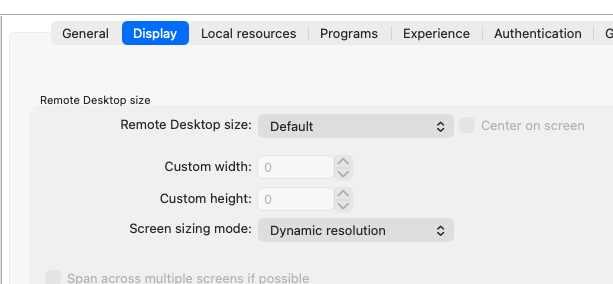
Please let me know if something isn't clear or you have further questions
Kind regards,
Richard Markievicz
Screenshot 2026-08-10 at 10.16.21.png
Thanks, that explanation fits the behavior very well. I had no particular reason for using Smart Reconnect—it was simply an old setting that remained in my RDP configuration.
I’ll switch to Dynamic Resolution while keeping Remote Desktop size set to Default, restart RDM and test it.
The fact that this configuration followed me between machines may also explain why I consistently experienced the issue while it remained uncommon for other users.
Thanks for tracking it down!
And wow, to be honest, I had no idea about dynamic resolution - was this here say 5y ago ? Just switched to it and it much faster/better.
I am using it for a long time, but not exactly a "pro" RDM user, probably 90% of its options I never use..
Thanks again and will report if this stopped the leak.
Hello
Ok, excellent. Dynamic Resolution is an RDP 8.1 feature, so Microsoft introduced it in the Windows 8 timeline. Older servers don't support it but they're starting to be edge cases these days. In terms of RDM, I'm not sure; if I had to guess it was probably added 5 or 6 years ago which might put this just on the threshold of when you started with RDM. Overall, yes, it's a much better workflow and if the server supports it I encourage using it.
Right now I think the issue you've exposed here is around reconnect, so even if that's true it doesn't go away completely with switching to dynamic resolution but it should be a lot better behaved over a single, long running session.
I'll make a ticket to fix the underlying issue that I've uncovered, but I'll also really appreciate you coming back and let me know if your memory stats are looking better.
Thanks and kind regards,
Richard Markievicz
Hi, same RDM process and RDP session using Metal + Dynamic Resolution, over 24h 28m, with normal use and several window resizes. Memory increased from 964 MB to 1,130 MB, suggesting Dynamic Resolution avoids the large growth seen with Smart Reconnect.
Attached the captures.
With 48GB of ram I was close to call it a day, but 11+GB usage and I was like " what the f, do I need to sell my car and get the 128 GB macbook pro ?" :D
Thank you for tracking this down!
rdm-footprint-dynamic-T0.txt
rdm-top-dynamic-T0.txt
rdm-top-dynamic-T1.txt
rdm-footprint-dynamic-T1.txt
Hello
do I need to sell my car and get the 128 GB macbook pro
Indeed, and I am sorry for the inconvenience. This is bad behaviour on our side.
I've made a ticket to fix the underlying issue with reconnects; as I wrote you will still leak a little memory if you manually reconnect. But it should be nothing compared to your prior workflow of many reconnects over extremely long running (both RDP and RDM) sessions. In the meantime, I'm glad that dynamic resolution is a reasonable workaround (and probably a good workflow improvement for you as well).
Thanks for your help debugging the problem. We'll post back here once there's an update.
Kind regards,
Richard Markievicz
Unfortunately, Dynamic Resolution only appeared stable in the short term. The same RDM process and RDP session from the previous T0/T1 captures has now been running for 20 days. During the last several days, RDM mostly remained untouched in the Dock, with the same RDP session connected.
Memory has now reached 12 GB, of which footprint reports 10 GB as IOSurface. I’ve attached the new T2 footprint and top captures. The PID is still 88589, matching the earlier T0 and T1 captures.
Sorry, again, it is ok for me, I can close it / open again to clear the ram, but it is just that I have spent some time and you too, so just want to help fixing this nasty leak...
rdm-footprint-dynamic-T2-20days.txt
rdm-top-dynamic-T2-20days.txt
Hi
You're right to highlight this, and I appreciate the feedback.
Is it possible it's the same issue I've already identified? i.e. 20 days is a very long running session, is it possible the session went through multiple reconnects? Switching networks, sleep/wake your machine, things like that?
I still need to close the reconnect issue and I'll try to work on that this week. At the same time, I'll see about adding some extra diagnostics to the application.
Thanks again, and kind regards
Richard Markievicz
Hi Richard,
I captured another data point from the same PID. In approximately 43 hours, RDM increased from 12 GB to 15 GB, while IOSurface increased from 10 GB across 1,327 regions to 14 GB across 1,479 regions. During that interval, macOS recorded 67 sleep entries, 66 DarkWakes and one full wake. This does not confirm how many RDP reconnects occurred, but it makes the sleep/reconnect explanation plausible.
Thanks!
rdm-footprint-dynamic-T3-21days.txt
rdm-top-dynamic-T3-21days.txt
Hello,
Thank you for being so patient!
I'm pleased to inform you that a new version of RDM Mac (2026.3.0.5) has been released, featuring the fix for your issue.
Latest Version: Download RDM
Please let us know if this works or if you encounter any issues.
Best regards,
Maxim Robert
Hello,
Thank you for being so patient!
I'm pleased to inform you that a new version of RDM Mac (2026.3.0.5) has been released, featuring the fix for your issue.
Latest Version: Download RDM
Please let us know if this works or if you encounter any issues.
Best regards,
@Maxim Robert
Amazing! I am on it now, hoping for the best.
Thanks to all @devolution team and especially to @Richard Markiewicz for figuring our fast what I was talking about!