v2026.3.16.0 Some annoyances in the favorites menu

I tested v2026.3.16.0 recently and there's some annoyances in the favorites menu (my old version was 2026.2.17.0). I have Azure Database datasource.
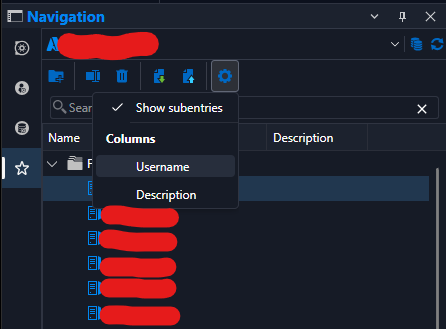
There's new Username and Description fields. By default, they take up space and cut off entry names.
a) Which is why I wanna turn them off. But even if I turn them off, they are still there (see picture).
b) The description field often shows up as empty, even if there is a description. Sometimes it shows.
c) Latency. When I single click favorite entries. there's a 1-2 second hang before it gets selected. In 2026.2.17 it happens instantly. (There's also a similar latency when opening the favorites menu by clicking the star icon, but this was also there in the old version). FYI I have around 50 favorites.
Also, when starting the app its often so slow that windows adds the "is not responding" message in the window.
I measured it to 34 seconds (including selecting datasource, and azure login (without writing the password, since it was already logged in). The same user flow took 24 seconds on the 2026.2.17.0, and it did not show a "not responding" message.
None of these are big issues but I thought I'd report them anyway, and I mainly wanted to report nr 1 cause that looks like a bug.
All Comments (4)
Hello,
We reproduced the delay when clicking an entry in Favorites and found the cause. We are opening a ticket for it, and also one for the column issues you reported: the Username and Description columns staying visible after you turn them off, and the Description field sometimes showing empty.
For the slow startup, could you please send us your startup logs?
Start RDM as usual and wait until it has finished loading.
Go to Help > Performance profiling.
Open the Startup logs tab.
Use the copy button to copy the log, and paste it here or in a text file.
The startup logs are recorded by default, so you don’t need to change any setting.
Regards
Jonathan Del Signore
Hi again. Doesn't seem like this slowness is recorded in the startup logs. According to the progress bar at the bottom, its mostly on the "loading connections" step that takes time (it comes after doing the Azure login to the database).
=== Main Thread ===
Preload deps: BusinessManager : 315 ms
Load options...
Load options: wait for preload : 235 ms
Load options apply: set language : 5 ms
Load options apply: ApplyOptions : 29 ms
Load options : 296 ms
Load policies : 19 ms
Update manager init : 12 ms
Avalonia BuildAvaloniaApp : 385 ms
Avalonia SetupWithClassicDesktopLifetime...
AvaloniaApp: Initialization.Initialize : 115 ms
AvaloniaApp: AvaloniaXamlLoader.Load : 1488 ms
Avalonia SetupWithClassicDesktopLifetime : 2175 ms
FileManager.GetOfflineDataDirectory...
FileManager.GetLocalAppDataDataSourceDirectories : 1 ms
FileManager.GetOfflineDataDirectory : 1 ms
Initialize phase two...
Application tools init : 4 ms
Application communicator start : 366 ms
Now agent host init : 9 ms
Hook manager init : 1 ms
Desktop extension init : 2 ms
Initialize phase two : 698 ms
Create main form...
Main form constructor...
Apply styles : 1 ms
Menu tree (InitializeItems)...
Menu tree: main menu items : 108 ms
Menu tree: session action registry : 137 ms
Menu tree (InitializeItems) : 245 ms
Context menus : 2 ms
Decorators...
Decorators: Status bar host : 364 ms
Decorators: NavBar tree...
NavBar: new FreNavigationPanel...
NavBar panel: navigation bar : 56 ms
NavBar panel: connection tree ctor + LoadEngine...
BeginUpdate...
PreCreateGroups : 0 ms - Run count : 1
BeginUpdate : 1 ms
BeginUpdate...
PreCreateGroups : 0 ms - Run count : 1
BeginUpdate : 0 ms
NavBar panel: connection tree ctor + LoadEngine : 241 ms
NavBar panel: data source selector layout : 184 ms
NavBar: new FreNavigationPanel : 484 ms
Decorators: NavBar tree : 485 ms
Decorators: Status bar...
Status bar: create items : 4 ms
Status bar: context options : 1 ms
Status bar: subscribe manager events : 3 ms
Status bar: load options : 1 ms
Decorators: Status bar : 11 ms
Decorators: Dock menus : 6 ms
Decorators : 867 ms
Ribbon action wiring : 8 ms
Avalonia top section...
Top section: title bar view build : 69 ms
Top section: view build : 5 ms
Top section: apply ribbon visibility...
Top section: content build...
RibbonView InitializeComponent (tab headers) : 7 ms
Top section: content build : 10 ms
Top section: apply ribbon visibility : 10 ms
Avalonia top section : 85 ms
Main form constructor : 1398 ms
Create main form : 1398 ms
BeginUpdate...
PreCreateGroups : 0 ms - Run count : 1
BeginUpdate : 0 ms
BeginUpdate...
PreCreateGroups : 0 ms - Run count : 1
BeginUpdate : 0 ms
Docking host: view model : 88 ms
Docking host: view build : 21 ms
Docking host: tab group bar : 1 ms
Docking view: apply layout : 102 ms
Docking view: synchronize documents : 2 ms
OfflineManager.GetDataSourceSettings : 5 ms
BeginUpdate...
PreCreateGroups : 0 ms - Run count : 1
BeginUpdate : 0 ms
BeginUpdate...
PreCreateGroups : 0 ms - Run count : 1
BeginUpdate : 0 ms
FrmMainDocumentManager.SetControlStates...
Main...
SessionMenuManager.SetControlStates...
SetControlStatesCustomFolder : 1 ms
SetControlStatesExportMenu : 2 ms
SessionMenuManager.SetControlStates : 8 ms
EmbeddedMenuManager.SetControlStates : 5 ms
MainMenuManager.SetControlStates...
SetControlStatesFile : 7 ms
SetControlStatesReportReportsMenu : 2 ms
MainMenuManager.SetControlStates : 15 ms
Decorators : 29 ms
Main : 59 ms
Ribbon action states (fan-out) : 113 ms
FrmMainDocumentManager.SetControlStates : 183 ms
Top section: content build...
Ribbon action states (fan-out) : 2 ms
Top section: content build : 2 ms
RefreshDataSources : 1 ms
=== Thread 7 (MainUIThread) ===
Preload: MigrateFreeOptions : 1 ms
Preload: DoLoadOption...
DoLoadOption: deserialize : 949 ms
DoLoadOption: InitializeOptions : 5 ms
Preload: DoLoadOption : 954 ms
Preload: DoLoadOptionEncryption : 25 ms
=== Thread 9 (MainUIThread) ===
Preload: DoLoadOptionExtension : 755 ms
=== Thread 10 (MainUIThread) ===
Preload: DoLoadOptionAnalytics : 736 ms
Regarding the startup, I realize the app will try to start wherever I left off. So I did some more testing
Start into a normal vault -> slow (RDM says 454 entries in the lower right corner)
Start into favorites menu -> slow (RDM still says 454 entries in the lower right corner. But when I mark all favorites and right click them, I have 52 entries selected)
Start into a smaller normal vault -> fast (RDM says 5 entries)
Start into favorites menu again -> fast (RDM says 5 entries)
I guess this means RDM loads my last vault, even if I start into the favorites menu. And if its a big vault, startup will be slow.
I can also add that switching to that big vault in the vaults menu is relatively fast considering the size, maybe 1-2 seconds.
No sessions were opened / reopened during those tests.
Hello,
We've applied a fix for the delay on click in the favorites, which will be included in version 2026.3.17. Please let us know if you still encounter any other issue of the sort.
Another fix for the Username and Description columns not hiding and/or not displaying their content will be included in version 2026.3.18.
For the startup time, the fact that it loads the last vault is normal. We always load the shared vault first, then whatever view you're into (favorites in this case). We'll investigate to see if there's an issue with the load though, because 34sec sounds long to me.
Regards
Jonathan Del Signore