RDM 2026.2.5.0: very Slow when have active Vault Filter
RDM 2026.2.5.0 / 2026.2.7.0
DVLS 2026.2.4.0
Hi All
Please move this to Bug Section if its a Bug, thanks!
When having an active Vault Filter (left bottom corner), then the whole RDM hangs a little and Server Tab Switching kills your patience.
After removing the active Filter, everything is working normal again.
Thanks for looking at!
Best Regards
Andreas
beadc8a3-bf67-4738-90e1-388fafaef93a.png
All Comments (11)
Hello,
Just to help me understand, it's when you switching opened tabs? Could you give me more details like the number of opened connections?
Regards
David Hervieux
Hello,
Just to help me understand, it's when you switching opened tabs? Could you give me more details like the number of opened connections?
Regards
@David Hervieux
Just try it by yourself - it doesnt matter if you have 2, 4 or 10 opened Sessions. As soon you remove the active Filter, everything is back fast.
Edit: I just realized, it happens only when you have much entries in Vault.
In my Case 1900+ and 2400+. When i do it in a Vault with only 2 Folders in it, its still fast.
Hi Andreas,
We have not yet been able to reproduce the issue with a vault containing 10,000 entries. Would it be possible for you to generate a mini dump file while the process is frozen and send it to us?
If so, please carefully follow the steps outlined here (see warning):
https://docs.devolutions.net/rdm/kb/troubleshooting-articles/hung-rdm-dump-file-creation/
Best regards,
Stéfane Lavergne
Hi Andreas,
We have not yet been able to reproduce the issue with a vault containing 10,000 entries. Would it be possible for you to generate a mini dump file while the process is frozen and send it to us?
If so, please carefully follow the steps outlined here (see warning):
https://docs.devolutions.net/rdm/kb/troubleshooting-articles/hung-rdm-dump-file-creation/
Best regards,
@Stéfane Lavergne
Just to clarify: RDM is not hanging. Its just very slow when trying to interact with RDM.
If you want i can show you everything via Remote.
Edit: Just activated Profiler with extended Level (507903).
Here is what i noticed:
=== Main Thread ===
15:52:12.595713 - REMOTE:    GET - /api/connection/states...
15:52:12.596171 - REMOTE:     RefreshConnections : 8 ms
15:52:12.596178 - REMOTE:     GetAllConnectionStates...
15:52:12.596180 - REMOTE:         GetAllConnectionStates.CanView : 0 ms - Count : 3
15:52:12.596181 - REMOTE:     GetAllConnectionStates : 1 ms
15:52:12.596182 - REMOTE:    GET - /api/connection/states : 9 ms
15:52:12.603798 - REMOTE:    GET - /api/connection/openedconnections : 18 ms
15:52:13.127603 - REMOTE:    GET - /api/accessrequest/all...
15:52:13.127608 - REMOTE:     GetAllAndUpdateExpired...
15:52:13.127609 - REMOTE:         GetAll : 0 ms
15:52:13.127609 - REMOTE:         UpdateWhenExpired : 0 ms
15:52:13.127609 - REMOTE:         AddConnectionName : 0 ms
15:52:13.127610 - REMOTE:     GetAllAndUpdateExpired : 0 ms
15:52:13.127610 - REMOTE:    GET - /api/accessrequest/all : 0 ms
15:52:13.127626 - DVLS - Api - .GetAccessRequests...
15:52:13.127631 -     WebAPI.GetAccessRequests : 18 ms
15:52:13.127640 - DVLS - Api - .GetAccessRequests : 18 ms
15:52:13.148407 - REMOTE:    GET - /api/connection/server-time/df47e61e-0ba0-46a7-9116-300515eea2de : 0 ms
15:52:13.148420 - DVLS - Api - .GetServerTime...
15:52:13.148436 -     WebAPI.GetServerTime : 20 ms
15:52:13.148439 - DVLS - Api - .GetServerTime : 20 ms
15:52:18.676328 - ApplyFilter...
15:52:18.676345 -     Filter : test
15:52:21.001868 -     TreeView.LoadConnectionList...
15:52:21.001873 -         BeginUpdate...
15:52:21.001883 -             LoadConnectionInTreeNode : 2318 ms
15:52:21.001888 -         BeginUpdate : 2322 ms
15:52:21.001888 -     TreeView.LoadConnectionList : 2324 ms
15:52:21.005233 - ApplyFilter : 2329 ms
15:52:21.134534 - REMOTE:    GET - /api/connection/server-time/3c411b9f-ff12-4579-a12b-32a9048c9299 : 0 ms
15:52:21.134550 - SelectionChanged - Default...
15:52:21.134552 -     DVLS - Api - .GetServerTime...
15:52:21.134555 -         WebAPI.GetServerTime : 22 ms
15:52:21.134560 -     DVLS - Api - .GetServerTime : 22 ms
15:52:21.169702 - REMOTE:    GET - /api/attachment/4651b21d-c844-4a6f-ab9a-4dfd2ea193c9 : 5 ms
15:52:21.197608 - REMOTE:    GET - /api/handbook/4651b21d-c844-4a6f-ab9a-4dfd2ea193c9 : 1 ms
15:52:23.479698 - SelectionChanged - Default : 2369 ms
15:52:30.960725 - REMOTE:    GET - /api/connection/server-time/d535690f-e48e-4243-af4b-78c53f3683e4 : 0 ms
15:52:30.960739 - DVLS - Api - .GetServerTime...
15:52:30.960742 -     WebAPI.GetServerTime : 18 ms
15:52:30.960744 - DVLS - Api - .GetServerTime : 18 ms
15:52:40.548863 - REMOTE:    GET - /api/connection/server-time/2040515f-b25f-4e51-af0f-dd8b0c3a2ce7 : 0 ms
15:52:40.548883 - DVLS - Api - .GetServerTime...
15:52:40.548887 -     WebAPI.GetServerTime : 18 ms
15:52:40.548895 - DVLS - Api - .GetServerTime : 18 ms
15:53:11.463637 - REMOTE:    GET - /api/connection/server-time/4da108fa-a7d3-4822-931a-ed426dccf401 : 0 ms
15:53:11.463651 - FrmMainDocumentManager.SetControlStates...
15:53:11.463652 -     Main...
15:53:11.463653 -         SessionMenuManager.SetControlStates...
15:53:11.463653 -             SetControlStatesTempAccessMenu...
15:53:11.463654 -                 DVLS - Api - .GetServerTime...
15:53:11.463658 -                     WebAPI.GetServerTime : 17 ms
15:53:11.463660 -                 DVLS - Api - .GetServerTime : 17 ms
15:53:11.463677 -             SetControlStatesTempAccessMenu : 17 ms
15:53:11.463913 -         SessionMenuManager.SetControlStates : 18 ms
15:53:11.467483 -         MainMenuManager.SetControlStates...
15:53:11.467489 -             SetControlStatesReportReportsMenu : 2 ms
15:53:11.467591 -         MainMenuManager.SetControlStates : 3 ms
15:53:11.469210 -         FreEmbeddedDashboard.SetControlStates : 1 ms
15:53:13.798922 -         Decorators...
15:53:13.798928 -             FrmMainDocumentManager.SetControlStates...
15:53:13.798929 -                 Main...
15:53:13.798930 -                     MainMenuManager.SetControlStates...
15:53:13.798933 -                         SetControlStatesReportReportsMenu : 2 ms
15:53:13.799091 -                     MainMenuManager.SetControlStates : 3 ms
15:53:13.816813 -                     EmbeddedMenuManager.SetControlStates : 17 ms
15:53:13.818940 -                     FreEmbeddedDashboard.SetControlStates : 2 ms
15:53:16.115957 -                     Decorators : 2296 ms
15:53:16.115965 -                 Main : 2320 ms
15:53:16.115967 -             FrmMainDocumentManager.SetControlStates : 2321 ms
15:53:16.116157 -         Decorators : 4645 ms
15:53:16.116161 -     Main : 4670 ms
15:53:16.116162 - FrmMainDocumentManager.SetControlStates : 4671 ms
15:53:27.601488 - REMOTE:    GET - /api/connection/openedconnections : 19 ms
15:53:27.628807 - REMOTE:    GET - /api/connection/states...
15:53:27.628876 - REMOTE:     RefreshConnections : 5 ms
15:53:27.628877 - REMOTE:     GetAllConnectionStates...
15:53:27.628878 - REMOTE:         GetAllConnectionStates.CanView : 0 ms - Count : 3
15:53:27.628878 - REMOTE:     GetAllConnectionStates : 1 ms
15:53:27.628881 - REMOTE:    GET - /api/connection/states : 6 ms
Ok, let's hold off on the dumps for now.
Can you rerun it with the profiler level set to 1, auto mode enabled with a 100ms interval?
We're seeing a few slow calls, but not the details. Hopefully auto mode will capture the culprit.
Decorators : 2296 ms
LoadConnectionInTreeNode : 2318 ms
Stéfane Lavergne
Ok, let's hold off on the dumps for now.
Can you rerun it with the profiler level set to 1, auto mode enabled with a 100ms interval?
We're seeing a few slow calls, but not the details. Hopefully auto mode will capture the culprit.
Decorators : 2296 ms
LoadConnectionInTreeNode : 2318 ms
@Stéfane Lavergne
Sure, here you are.
Ive enabled as you wrote above, then added Filter, switched 2 Tabs, then removed the Filter again.
Level: 1 [Debug], Auto-Mode (100 ms): True

=== Main Thread ===
16:03:38.434269 - ApplyFilter...
16:03:38.434279 -     Filter : test
16:03:40.783838 -     TreeView.LoadConnectionList...
16:03:40.783843 -         BeginUpdate...
16:03:40.783844 -             LoadConnectionInTreeNode : 2341 ms
16:03:40.783846 -         BeginUpdate : 2345 ms
16:03:40.783846 -     TreeView.LoadConnectionList : 2349 ms
16:03:40.791515 - ApplyFilter : 2357 ms
16:03:43.261026 - SelectionChanged - Default...
16:03:43.261031 -     · Finally...
16:03:43.261031 -         · UIManager.FrmMain.EnableSetControlStates...
16:03:43.261032 -             · FrmMainDocumentManager.SetControlStates...
16:03:43.261032 -                 · Main...
16:03:43.261033 -                     · Decorators : 2325 ms
16:03:43.261038 -                 · Main : 2331 ms
16:03:43.261041 -             · FrmMainDocumentManager.SetControlStates : 2331 ms
16:03:43.261042 -         · UIManager.FrmMain.EnableSetControlStates : 2331 ms
16:03:43.261045 -     · Finally : 2331 ms
16:03:43.261046 - SelectionChanged - Default : 2351 ms
16:03:51.679575 - · FrmMainDocumentManager.SetControlStates...
16:03:51.679578 -     · Main...
16:03:51.679579 -         · Decorators...
16:03:51.679579 -             · FrmMainDocumentManager.SetControlStates...
16:03:51.679579 -                 · Main...
16:03:51.679581 -                     · Decorators : 2338 ms
16:03:51.679585 -                 · Main : 2357 ms
16:03:51.679587 -             · FrmMainDocumentManager.SetControlStates : 2357 ms
16:03:51.679709 -         · Decorators : 4729 ms
16:03:51.679711 -     · Main : 4754 ms
16:03:51.679712 - · FrmMainDocumentManager.SetControlStates : 4756 ms
16:03:58.277893 - · FrmMainDocumentManager.SetControlStates...
16:03:58.277897 -     · Main...
16:03:58.277897 -         · Decorators...
16:03:58.277898 -             · FrmMainDocumentManager.SetControlStates...
16:03:58.277898 -                 · Main...
16:03:58.277899 -                     · Decorators : 2356 ms
16:03:58.277905 -                 · Main : 2377 ms
16:03:58.277907 -             · FrmMainDocumentManager.SetControlStates : 2377 ms
16:03:58.278054 -         · Decorators : 4735 ms
16:03:58.278056 -     · Main : 4763 ms
16:03:58.278057 - · FrmMainDocumentManager.SetControlStates : 4764 ms
16:04:03.254627 - ApplyFilter...
16:04:03.254636 -     Filter :
16:04:03.267896 -     TreeView.LoadConnectionList...
16:04:03.267900 -         BeginUpdate...
16:04:03.267903 -             LoadConnectionInTreeNode : 3 ms
16:04:03.267905 -             PreCreateGroups : 0 ms - Run count : 1
16:04:03.267906 -         BeginUpdate : 10 ms
16:04:03.267907 -     TreeView.LoadConnectionList : 13 ms
16:04:03.270466 -     Load Expand States...
16:04:03.270468 -         Expanded: 17 - Nodes : 2459
16:04:03.270915 -         Nodes...
16:04:03.270919 -             Expand : 0 ms - Run count : 13
16:04:03.270920 -         Nodes : 0 ms
16:04:03.270951 -     Load Expand States : 0 ms
16:04:03.275779 - ApplyFilter : 21 ms
16:04:03.438648 - SelectionChanged - Default : 64 ms

=== Thread 134 (.NET TP Worker) ===
16:03:27.604477 - Connection States: Refresh : 30 ms
I will need to investigate and attempt to reproduce the issue. We can see that the Decorators step consistently takes more than 2 seconds to complete, which is not expected.
I will get back to you once I have identified the cause of the issue or if I need any additional information.
Sorry for the inconvenience.
Best regards,
Stéfane Lavergne
I will need to investigate and attempt to reproduce the issue. We can see that the Decorators step consistently takes more than 2 seconds to complete, which is not expected.
I will get back to you once I have identified the cause of the issue or if I need any additional information.
Sorry for the inconvenience.
Best regards,
@Stéfane Lavergne
Many thanks!
What filter options have you enabled?
I'm assuming "All vaults" is not selected.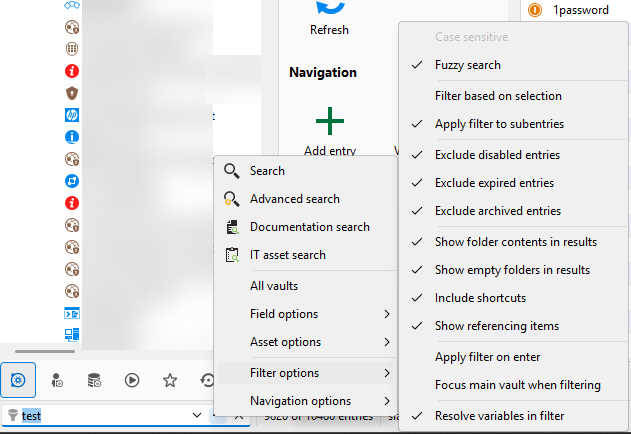
Stéfane Lavergne
18b90dc0-3f68-4368-b1c3-16617fccb0b5.png
What filter options have you enabled?
I'm assuming "All vaults" is not selected.
@Stéfane Lavergne
Ive the following Options set: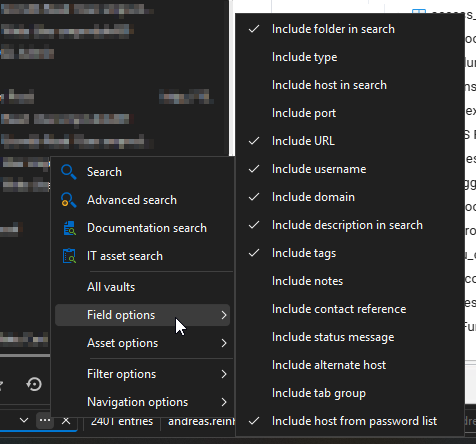
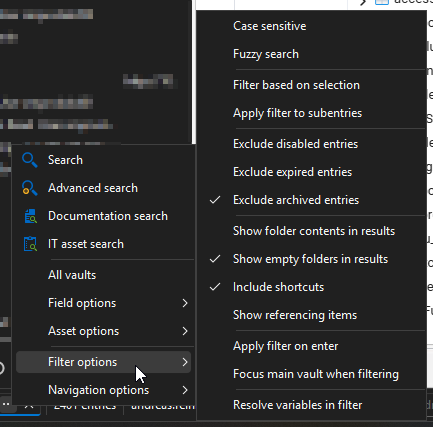
645ff2f0-ddda-49eb-8388-ea8bfd3a2a94.png
bf784f5e-2cea-4d2b-aa88-ac0f2fb84069.png
Still not reproducing. Can you tell me more about your data structure?
- Do you have a deep folder structure?
- Do you use variables? If so, which ones?
- What type of connections are you using (RDP, web, etc.)?
- Do you use linked credentials?
Thanks.
Stéfane Lavergne