High CPU usage after Update tor Version 2026.1.12.0
Hi
We've noticed that since the update, Remote Desktop Manager's CPU usage is significantly higher.
This is resulting in network interruptions on our Windows 365 clients when using Remote Desktop Manager.
Is anything known about this?
Regards,
Oliver
All Comments (56)
Hello,
Thank you for reporting this.
At the moment, we do not have any known issues reported regarding increased CPU usage with version 2026.1.12.0. If possible, could you provide a bit more information so we can investigate further?
For example:
- The exact CPU usage observed for the RDM process
- Whether it happens constantly or only during specific actions
- If the issue persists after restarting Remote Desktop Manager
- The number of sessions or entries open when the CPU usage increases
Additionally, if you are able to capture a process dump or logs, that could help us analyze what is consuming the CPU.
Looking forward to your feedback.
Best regards
Carl Marien
We see same issue!
35-40% of CPU utilization in RDM without doing anything in the application. This is on a shared jumphost running Windows server 2022.
Hello,
Thank you for your follow-up and for confirming that you are experiencing the same behavior.
At this time, we are still unable to reproduce the issue on our end. We are continuing our investigation based on the information previously requested.
Additionally, if you are able to provide application logs, this would greatly help us identify what may be causing the increased CPU usage.
We appreciate your collaboration and look forward to your feedback.
Best regards,
Carl Marien
Hello
We had a somewhat similar issue recently that only affected older versions of Windows, but it will be worth checking if the same fix applies in your situation.
In Settings > Performance > Avalonia, uncheck the following options
- Enable WinUI composition mode
- Enable direct composition mode
So the settings should look like this: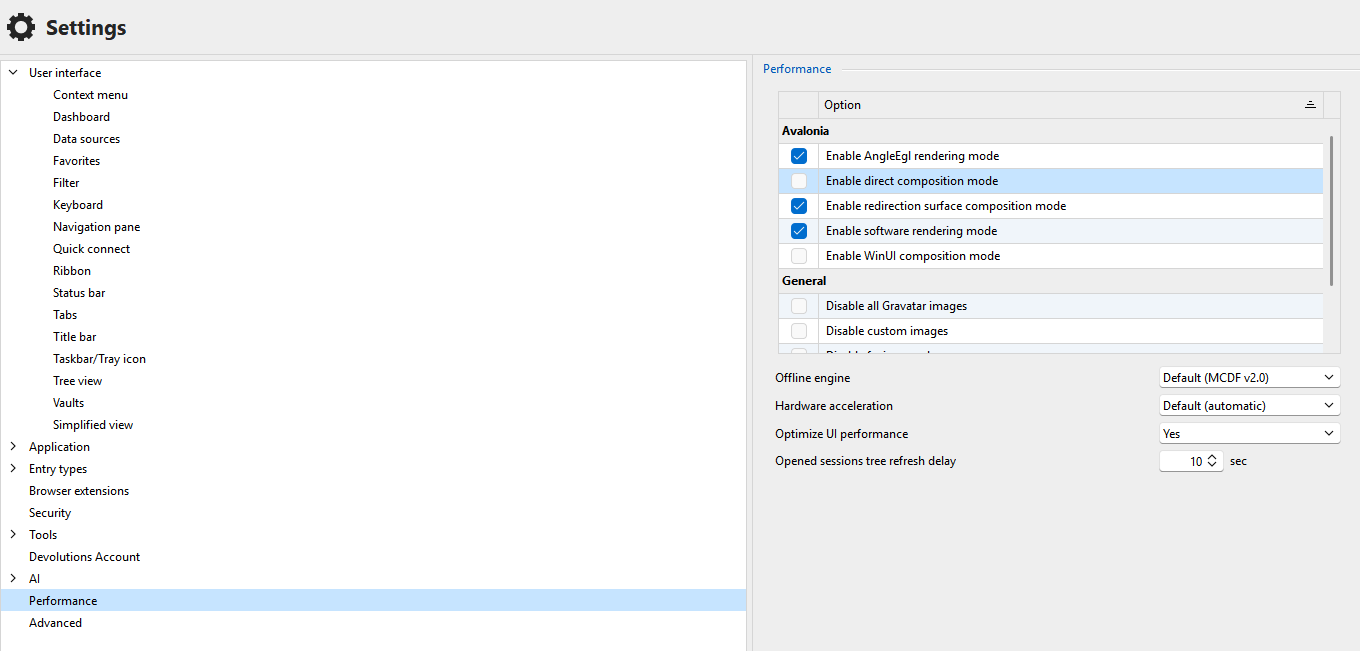
Save the changes and restart RDM. Does it help?
If not, further uncheck "Enable AngleEgl rendering mode". So now the settings look like this: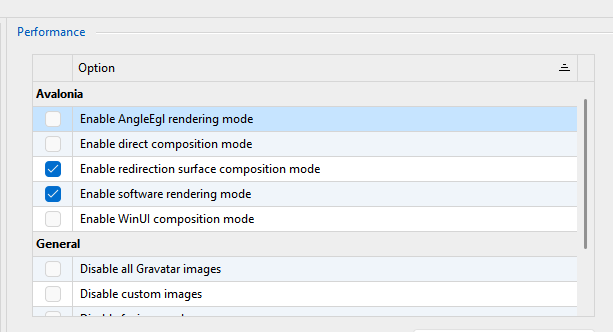
Save the changes and restart RDM. Does it help?
If not, in terms of concrete next steps: you can re-enable all those settings and once more save changes and relaunch RDM. Then the following steps might help us to identify the problem:
- Download procdump from Microsoft / SysInternals
- Extract the download to a location on disk
- From an administrative command prompt, `cd` to the extracted procdump directory
- Run RDM (if it's not running already) and let it idle. We want it to be already running so we're capturing the idle state, not the startup cost.
- Back in the command prompt run `procdump64.exe RemoteDesktopManager.exe -c 10 -s 5 -n 10`. You may need to accept the license agreement which pops up.
This will instruct procdump to generate a minidump from RDM every time processor utilization exceeds 10% for 5 seconds, exiting after capture 10 minidumps. The command prompt will give some feedback as it generates the mini dumps. Based on your post I believe this should be an appropriate configuration.
procdump will write the dump files to the current directory and they'll be named like "RemoteDesktopManager.exe_{date}_{time}.dmp".
Once you've gathered these files please let us know and the support team can provide you an avenue to upload them to us. Do not post them here on the public forum. I encourage you to read the security disclaimer around dump files.
Please let me know if you have any questions
Kind regards,
Richard Markievicz
Screenshot 2026-03-17 at 14.46.26.png
Screenshot 2026-03-17 at 14.46.11.png
Hi
I worked with Windows 365 all day. Remote Desktop Manager was always open in the background with a session. I had no problems all day.
After I closed (sleep) the Windows 365 session and reopened it, the problem with high CPU usage occurred.
The CPU usage of Remote Desktop Manager constantly fluctuates between 40 and 70%.
As a side effect, Windows 365 keeps losing its network connection and closing the session.
When Remote Desktop Manager is closed, the Windows 365 client recovers.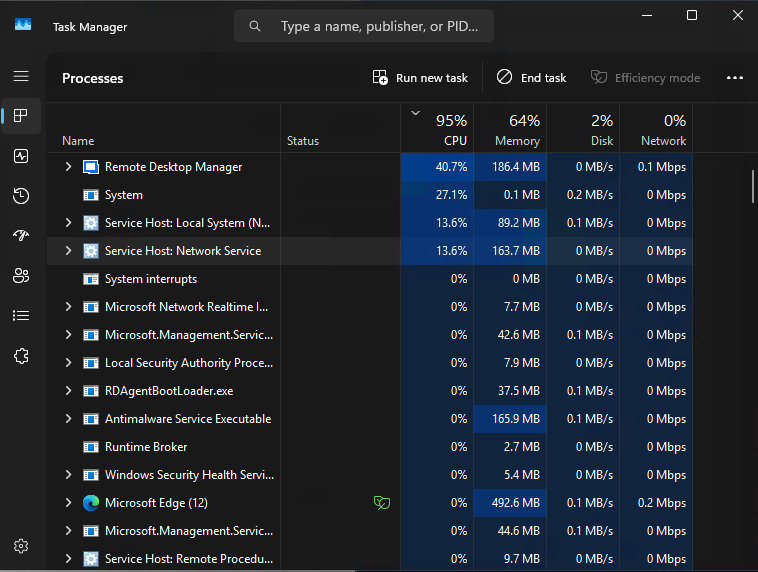
I adjusted the settings according to your suggestion, but the error occurred again.
I my case, I can reproduce the failure now.
Kind regards,
Oliver
53a97027-ab3e-4054-8b37-07c6c488d07e.png
Hello
The next step is to generate diagnostic information as in the second part of my post. Please let me know if you have some questions.
Kind regards,
Richard Markievicz
Hi,
We’re experiencing the same issues with version 2026.1.12 running on a Windows Server 2019 Remote Desktop Session Host.
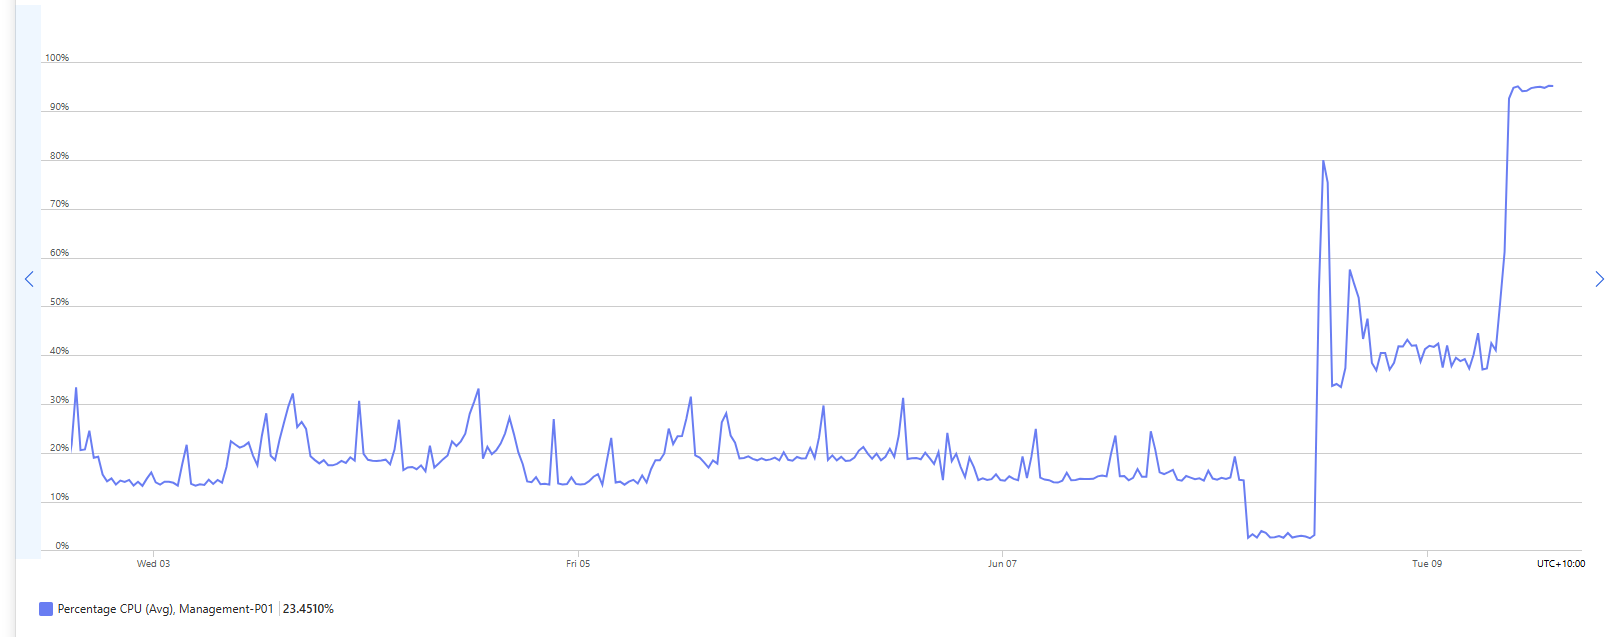
Based on our observations, the problem appears to have started with version 2026.1.10. The graph from our monitoring system clearly shows a noticeable change in CPU usage following the installation of version 2026.1.10 on the morning of March 9.
Task Manager also confirms that the increased CPU usage is caused by RDM.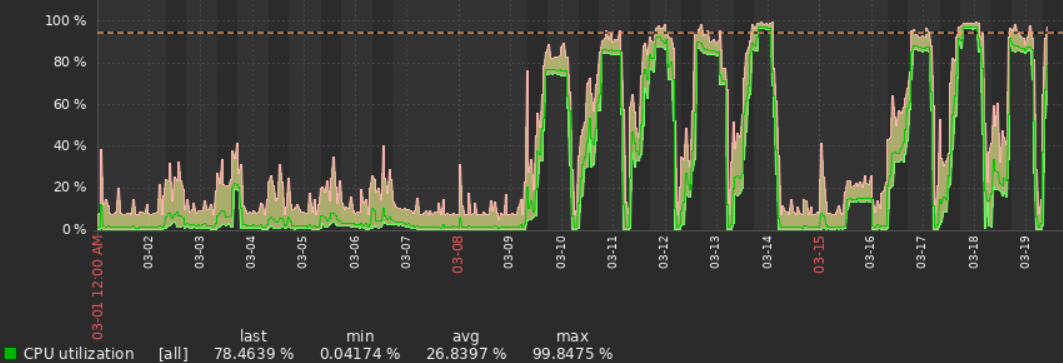
467def98-fd1a-40ef-8bcc-cfe6a14b5e46.png
Is there anything we can help to get futher with this issue - we have same issue.
We tried to change settings in the "Performance" selection, but for now still issues.
Hello
The next step is to generate diagnostic information as in the second part of my post. Please let me know if you have some questions.
Kind regards,
Richard Markievicz
Hello
The next step is to generate diagnostic information as in the second part of my post. Please let me know if you have some questions.
Kind regards,
@Richard Markiewicz
Hi Richard
I've created the dump as you requested.
How can I send you this data?
Regards,
Oliver
Hello,
I will send you a link via private message with instructions on how to safely send the minidump.
Best regards,
Carl Marien
Any updates?
Hello everyone,
Thank you for your patience.
We have received multiple dump files from Oliver and are currently analyzing them to identify the root cause of the increased CPU usage. At this stage, we can confirm that the issue appears reproducible in certain environments, particularly after resuming sessions (e.g., Windows 365 or RDS scenarios), but we are still validating the exact trigger.
Our team is actively investigating the data, and we will provide an update as soon as we have more concrete findings or a potential fix/workaround.
In the meantime, if others are experiencing the same behavior and are able to provide additional dumps or logs, it would help us confirm patterns across different environments.
Thank you again for your collaboration.
Best regards,
Carl Marien
Hello
Thanks everyone in this thread for your patience. I've analyzed the data that @oliveroberholzer sent and found a smoking gun for the cause of this. I'll implement a fix ASAP and get that in the next release, and update you once that's available (it should not be too long).
In the meantime I'm afraid I don't have any workaround. I can tell you that this appears to be because we are triggering a bug in the Yubico SDK for a feature that optimistically tries to detect if you have an attached Yubikey. It would be really helpful if we can find any commonality between the users in this thread because I don't know exactly what the cause of the bug is, and I cannot reproduce it, I only have a way to work around it. Things like: do you have a smartcard attached on your client device? Do you redirect smartcards to the host running RDM? Things like that.
In the meantime, please don't hesitate with further questions or comments
Kind regards
Richard Markievicz
Hello
Thanks everyone in this thread for your patience. I've analyzed the data that @oliveroberholzer sent and found a smoking gun for the cause of this. I'll implement a fix ASAP and get that in the next release, and update you once that's available (it should not be too long).
In the meantime I'm afraid I don't have any workaround. I can tell you that this appears to be because we are triggering a bug in the Yubico SDK for a feature that optimistically tries to detect if you have an attached Yubikey. It would be really helpful if we can find any commonality between the users in this thread because I don't know exactly what the cause of the bug is, and I cannot reproduce it, I only have a way to work around it. Things like: do you have a smartcard attached on your client device? Do you redirect smartcards to the host running RDM? Things like that.
In the meantime, please don't hesitate with further questions or comments
Kind regards
@Richard Markiewicz
Hi Richard
we do not have any smart cards or YubiKeys connected on our side.
Please let me know if you need any additional information from us.
Kind regards,
Oliver
Hello,
Thank you for your patience regarding the high CPU usage issue.
A fix has been implemented in a newer version of Remote Desktop Manager. Could you please update to version 2026.1.16 and let us know if the issue still occurs after the upgrade?
If the problem persists, feel free to share any additional observations.
Best regards,
Carl Marien
Hi Carl,
We're running current 2026.1.16 on a RDS Jumphost and I currently have +40% in CPU without any tasks in RDM.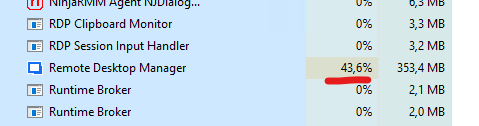
c1693254-e2ce-41a8-b965-95fc77b12c11.png
Hello @enoch
Pending feedback from other users, perhaps you are experiencing a different issue or the fix we made for .16 was not complete in some way.
If you can follow the troubleshooting steps I gave earlier I'll be able to look at the data straight away. I reproduce the instructions here:
- Download procdump from Microsoft / SysInternals
- Extract the download to a location on disk
- From an administrative command prompt, `cd` to the extracted procdump directory
- Run RDM (if it's not running already) and let it idle. We want it to be already running so we're capturing the idle state, not the startup cost.
- Back in the command prompt run `procdump64.exe RemoteDesktopManager.exe -c 10 -s 5 -n 10`. You may need to accept the license agreement which pops up.
This will instruct procdump to generate a minidump from RDM every time processor utilization exceeds 10% for 5 seconds, exiting after capture 10 minidumps. The command prompt will give some feedback as it generates the mini dumps. Based on your post I believe this should be an appropriate configuration.
procdump will write the dump files to the current directory and they'll be named like "RemoteDesktopManager.exe_{date}_{time}.dmp".
Once you've gathered these files please let us know and the support team can provide you an avenue to upload them to us. Do not post them here on the public forum. I encourage you to read the security disclaimer around dump files.
Thanks and kind regards,
Richard Markievicz
Hi
I've tested the new version 2026.1.16 on our W365 Client.
RDM works without any issues. Also the W365 Client. There is no Network Connection errors anymore.
From my side, thanks.
Oliver
Hello
For the users in this thread where the issue wasn't resolved, I think there were some lingering issues on our side but everything should be fixed in 2026.1.19 or later.
Please let me know if you still have a problem after updating.
Kind regards,
Richard Markievicz
We saw this issue on the same version as was originally posted. We also saw the improvement when the public release happened.
However, this morning, after an update to 2026.2.7.0, we seem to have come back to a very CPU intensive problem. Anyone else see it coming back ?
I do note that there's a 2026.2.8.0 update now available, and there's an improvement noted "Improved agent connections to survive RDP reconnections", is there any chance this is the fix to this issue?
 context: this is the CPU usage on the host that has our RDMan instance on it. We are a small team, less than 15 techs and regularly see a dozen connections to this host. Yesterday was a Monday but a non-working day for the majority, we had two people connect to the host to do some remote admin, at around 11am... the update must have been done by a colleague as I didn't initiate it but I had to complete the database update to finalise it. After that, the CPU usage went up, and ever since this morning when our business day started we have seen CPU starvation for all our users, and the graph shows we're constantly hitting that 100%, and I'm seeing at least 15% CPU for my own session, and the bulk of the CPU is from remotedesktopmanager.exe on all the other user sessions.
8384d552-bb47-4957-a874-878d7dc7fe92.png
Hi,
We're also seeing this issue again after installing version 2026.2.7.0.
Attached is a screenshot showing the CPU utilization on one of our RDP session hosts. RDM is consuming all available CPU resources.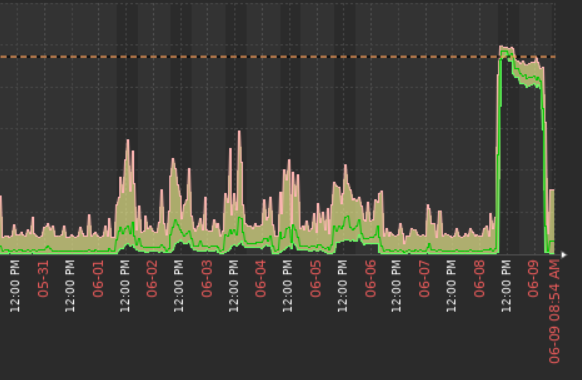
7c7dea0b-e4e7-4610-8600-d6f631878940.png
I've updated to 2026.2.8.0 and still seeing very high CPU usage on a single user (me) using Remotedesktopmanager.exe... thats me rebooting the host, then RDPing to the server, and then starting RDM. I've not had my session disconnect at all, so the behaviour isn't directly related to the disconnect/reconnect process.
Hi everyone,
Thank you for the reports. We're aware that the high CPU usage issue has returned following the 2026.2.. update, and our team is actively investigating. We'll post an update here as soon as we have more to share.
We appreciate your patience.
Best regards,
Stephan
Hello,
We haven't been able to reproduce the issue internally, but I think we've pinpointed it nonetheless. We've applied a fix, and you can expect it to take effect with the upcoming 2026.2.9 version.
If there are no unforeseen circumstances, this version should be released early next week.
Regards,
Jafran Majeau
Hi there,
Running 2026.2.9 version and still high cpu usage on a windows server 2025 terminal server.
Hello,
We're investigating this as one of our highest priority and will provide an update as soon as we can.
Regards,
Jafran Majeau
Hello
I think that based on what @brettpound wrote above, this is indeed different to the problem we had with the Yubico SDK running in terminal services on 2026.1.
We're trying to address this at a high priority but cannot reproduce it on our side.
What would be very helpful will be to capture a mini dump of the RDM process while it's exhibiting the issue. Instructions are here - I recommend following the directions for Process Explorer.
Once you have that, please read the disclaimer and let us know so we can provide a secure upload link. Don't post the file here or by email or otherwise.
If you have any questions or something isn't clear please let me know
Kind regards,
Richard Markievicz
Hello
I've a reasonable suspicion this is related to the Avalonia compositor or renderer or both. I can't say why it would only be triggered in a terminal services environment and only in 2026.2, so I'm still investigating that.
In the meantime, please check if the following helps; and if it does please let me know exactly what helps (that will be important information).
Go to File > Settings > Performance; in the Avalonia Rendering section you will find 5 checkboxes. By default they are all checked.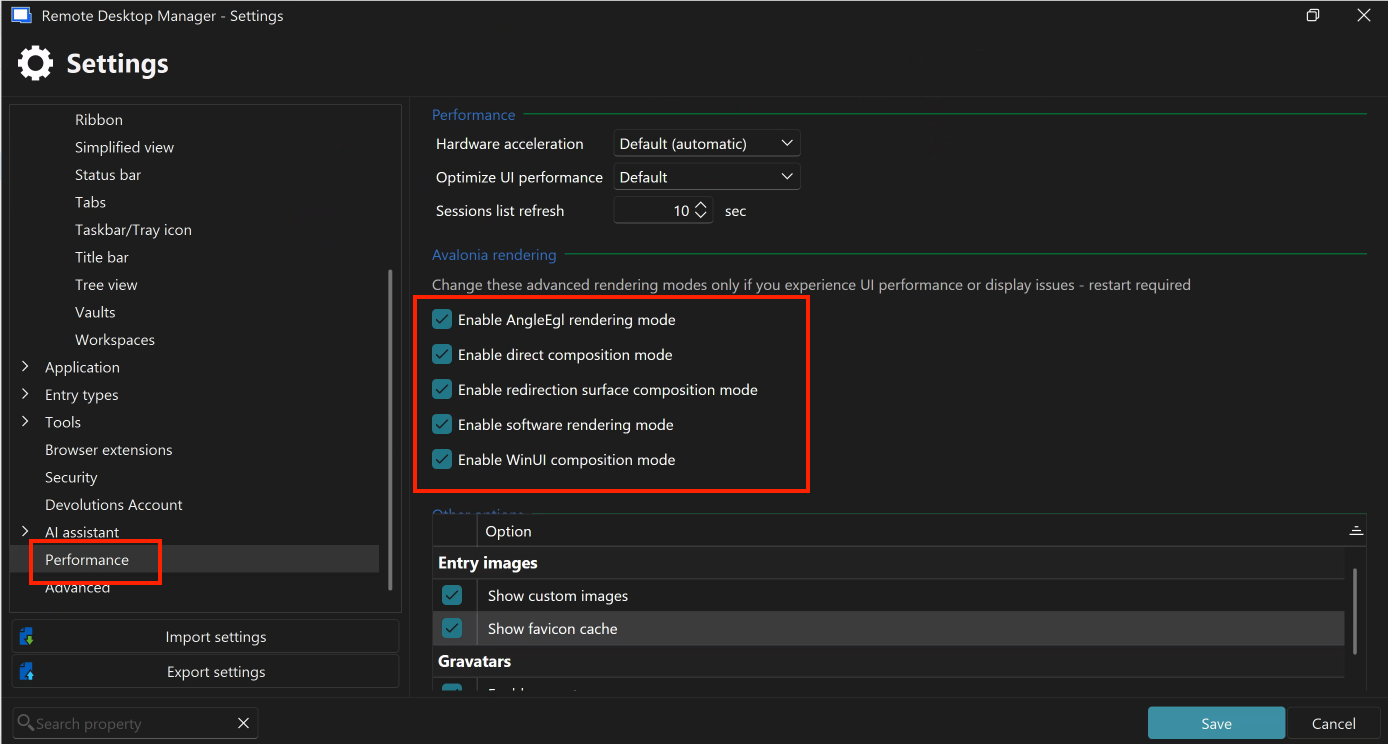
- Uncheck "Enable WinUI composition mode". Leave everything else as is. Save the changes and restart RDM. If the problem persists, go to the next step.
- Uncheck "Enable direct composition mode". Leave everything else as is (so you will now have 3 / 5 boxes checked). Save the changes and restart RDM. If the problem persists, go to the next step.
- Uncheck "Enable AngleEgl rendering mode". Leave everything else as is (so you will now have 2 / 5 boxes checked). Save the changes and restart RDM.
Please try that and let me know. The changes will progressively force non-GPU, more compatible rendering options. Hopefully this will unblock things as I work on this further.
Let me know if something isn't clear
Kind regards,
Richard Markievicz
Screenshot 2026-06-16 at 11.50.29.png
I’ve followed the steps you outlined and have only Software Rendering and Redirection surface composition mode enabled.
CPU utilization is better. It’s closer to 20-25% when active (10% when idle) whereas we averaged 50% or more before any changes (even while idle).
For comparison, RDCman is nearly 0% when idle with multiple sessions.
Hi,
We have unchecked all three options, but we cannot see any measurable difference.
RDM still consumes approximately 10–15% CPU while idle for all of our users, which places a considerable load on the host. We are running Windows Server 2019.
Hi,
I have unchecked "Enable WinUI composition mode", "Enable direct composition mode" and "Enable AngleEgl rendering mode" options and cpu utilization dropped to %20 from %50. By the way, only unchecking the "Enable AngleEgl rendering mode" option also drops the cpu utilization to %20 in my case.
Hello
Ok, so it seems like that has helped in a couple of cases but not a total mitigation.
From my side, I'm continuing to try, but I cannot reproduce the issue at all.
It would really accelerate things if I can get some deeper diagnostic data from one (or preferably) several of the users experiencing the problem.
First, a set of mini dumps that will capture some process state:
- Please read the security disclaimer around mini dumps
- Download procdump from Microsoft / SysInternals
- Extract the download to a location on disk
- From an administrative command prompt, `cd` to the extracted procdump directory
- Identify a problematic RDM instance running on the box
- At an administrator PowerShell prompt
Get-Process RemoteDesktopManager | Select-Object Id, SessionId, CPU, @{n='WS(MB)';e={[int]($_.WS/1MB)}} | Sort-Object CPU -Descending
- Will list active RDM process IDs and their CPU load. Find the PID of a good candidate.
- Back in the command prompt run
procdump64.exe -accepteula -mm -c 10 -s 5 -n 10 <PID>
This will instruct procdump to generate a minidump from RDM every time processor utilization exceeds 10% for 5 seconds, exiting after capture 10 minidumps. The command prompt will give some feedback as it generates the mini dumps. Based on your post I believe this should be an appropriate configuration.
procdump will write the dump files to the current directory and they'll be named like "RemoteDesktopManager.exe_{date}_{time}.dmp".
Second, a Windows ETL trace from the system where RDM is running and showing high CPU (the terminal server, in this case).
As administrator, save this file in a known location. In my case I named it `cpusamples.wprp`:
<?xml version="1.0" encoding="utf-8"?>
  <WindowsPerformanceRecorder Version="1.0">
    <Profiles>
      <SystemCollector Id="SC" Name="NT Kernel Logger">
        <BufferSize Value="1024"/>
        <Buffers Value="256"/>            <!-- 256 MB RAM buffer -->
      </SystemCollector>
      <SystemProvider Id="SP">
        <Keywords>
          <Keyword Value="ProcessThread"/>
          <Keyword Value="Loader"/>
          <Keyword Value="SampledProfile"/>   <!-- CPU samples only; NO CSwitch -->
        </Keywords>
        <Stacks>
          <Stack Value="SampledProfile"/>
        </Stacks>
      </SystemProvider>
      <Profile Id="CpuSamplesOnly.Verbose.Memory" Name="CpuSamplesOnly" Description="CPU samples only, in-memory"
               LoggingMode="Memory" DetailLevel="Verbose">
        <Collectors>
          <SystemCollectorId Value="SC"><SystemProviderId Value="SP"/></SystemCollectorId>
        </Collectors>
      </Profile>
    </Profiles>
  </WindowsPerformanceRecorder>
Now, assuming your administrator shell is in the directory where you saved that file
wpr -start .\cpusamples.wprp- Let it ride for 20 - 30 seconds
wpr -stop rdm-cpu.etl
It will take some time to process after stopping the trace, but the result should be the rdm-cpu.etl file in the current working directory. This only profiles CPU, no memory information so there are no concerns with the privacy of this file.
Finally, let me know when you have something available and the support team will provide you a secure upload link. Please don't post directly here on the forum.
Let me know if something isn't clear
Kind regards,
Richard Markievicz
I've sent thru some dumps and an etl trace to my sharepoint link
I have also some dumps if you want some :)
Hello,
If you still need the dump, we’re also affected (I’ve opened a support ticket: 00122226), so please let me know.
Thank you.
Hello @brettpound
I'm not certain your circumstances line up with some of the other posts here, where there is a lot of discussion about high idle CPU however your case seems to be an issue when users have at least one active RDP session up. Does that sound right?
In any case, I've done a quick analysis but it's not conclusive yet. I want to try and get you unblocked, can you check if you have this enabled:File > Settings > Entry types > Sessions > Remote Desktop (RDP) > Advanced > Enable RDP hardware mode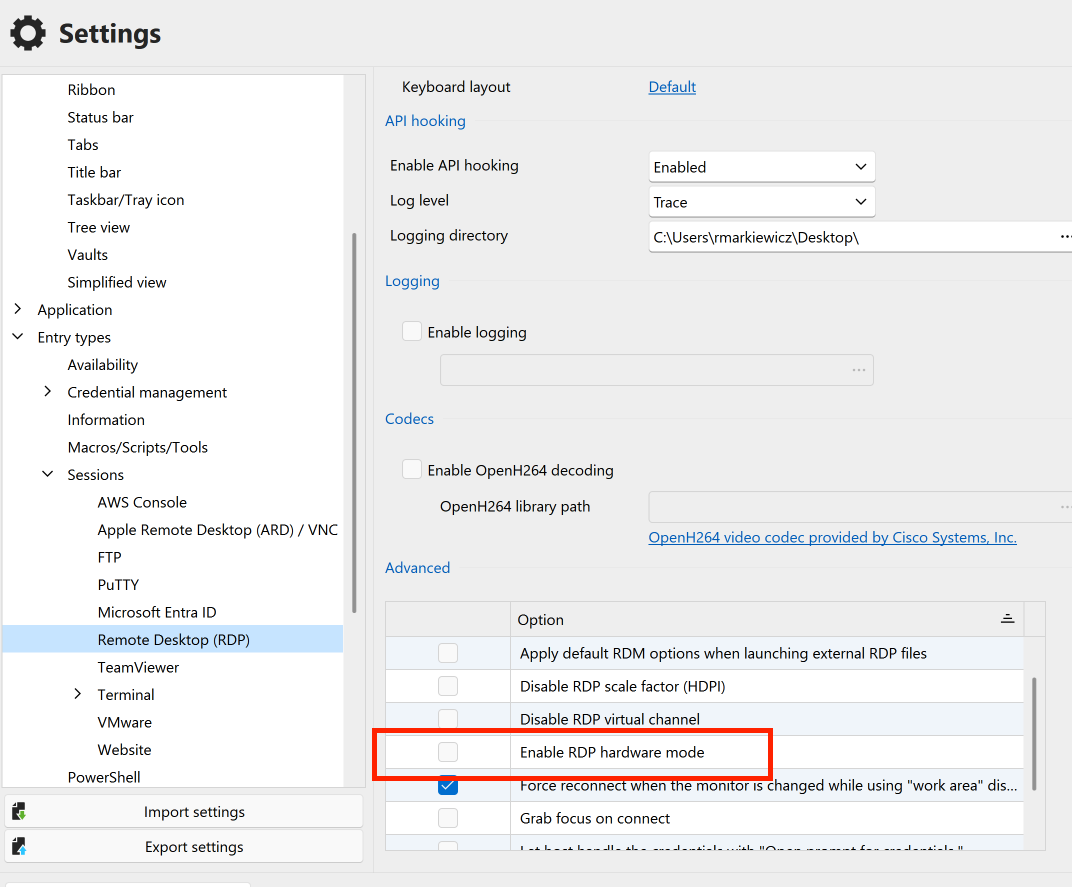
If it's enabled, please try disabling it and let me know if that improves the situation.
Kind regards,
Richard Markievicz
Screenshot 2026-06-18 at 09.36.09.png
That isn't set on me or our users... and unless the default has changed it hasn't changed for us.
We are predominantly an RDS support shop so it would be unusual to not see our techs with several RD sessions open at once. And certainly that RD focus hasn't changed for us from 2026.1x to immediately after the 2026.2 update applied, when we first noticed the performance difference.
Immediately post-impact and attempting to resolve with 2026.2.8 update, I rebooted the VM so there was only me connected to it, and only me running RDM, and even then I saw the laggy response to app movements and the VM CPU appeared high.
Our VM will reboot on Monday morning (GMT+10) before start of business so we will get some baseline info from then, I'm one of the early starters so will try to get stats. I'll also deploy 2026.2.11 as I hadn't got a chance to do .9 this week.
I know that in my dumps I didn't get a lot of "spare" CPU to my process so it took some time to meet the high CPU for 10-sec duration, as we don't have a high capacity VM running RDM for us - I suspect that might make it less relevant to investigate. Monday morning should give me a better view of the perf with minimal users and no previous day legacy, and I'll capture all the info again.
Hello
Thank you @brettpound and the others in this thread for your help.
I do believe I've hit upon the problem and submitted a mitigation fix to the RDM Windows team. My understanding is that they are eager to get this issue patched so I would expect you'll see this rolled into a minor update very soon; however more details will follow early next week.
Subsequently once that is in everyone's hands I'll work on a more comprehensive fix and provide a more detailed analysis of what the problem is and what we will change to prevent it reoccurring.
In the meantime, please don't hesitate with further questions or comments
Kind regards,
Richard Markievicz
Hello,
Thank you for your feedback. We’re looking forward to this new patch so we can enjoy a more responsive RDM environment again.
Do you know when this version is due to be released?
Thank you very much.
Have a nice day,
Kind regards.
Hi Team, we wanted to chime in here. We upgraded from RDM 2026.1.22.0 to 2026.2.11.0 yesterday. DVLS as backend on Azure SQL. We use RDM exclusively as a Citrix pub app from two Jump hosts for our IT-Admins, to provide remote support to our customers. Furthermore, we mostly use RDP, SSH and WebSessions.
Our CPU load increased significantly since yesterday, and we had to double Citrix VM resources, to make RDM run smooth again.
Should I create a support case to collect data from our side?
--
Citrix Technology Advocate (CTA) at https://www.meinekleinefarm.net
We are using 2026.2.11.0 64-bit (PreJIT)
on RDS server each session with RDM takes about 25% cpu
server is overloaded.
Hello
Sorry for the inconvenience.
I've spoken with the RDM Windows team and the next version should be built today; and land with the QA tomorrow. Conceivably if no major problems are found it could be available before the weekend. I'll update as more information becomes available (the timeline is a little bit loose right now as today is a public holiday in parts of Canada and many of the team are not available).
Thanks for your patience and understanding
Kind regards,
Richard Markievicz
Are there any workarounds to be had until we have an update to install, this is killing my servers ;/ Rollback to Version prior to 2026.2.x ? We run currently 80 Users over multible servers but only some users are killing the cpu and the more connections the more ressources they need aswell.
rdm 2026.2.11.0 64-bit / dvls 2026.2.9.0 on windows server 2022 -2025 RDS. All the same issues.
You can clearly see when we shipped the Update. And that is on all servers.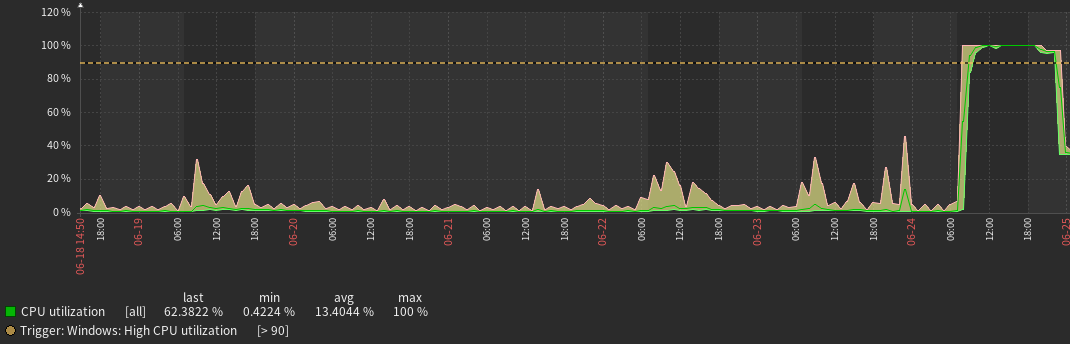
3ddb619b-eeb0-4bf2-a425-9d00cb24746e.png
Hello
I am sorry for the inconvenience.
First, there's not a complete workaround other than downgrade to 2026.1.x (probably not an option for you). However I recommend going to File > Settings > Performance; in the Avalonia Rendering section uncheck the box for "Enable AngleEgl rendering mode". Save the changes and restart RDM.
This will not completely resolve the high CPU scenario but it should mitigate it somewhat. On my 6-core machine, that drops CPU from 3 cores (50%) to 1 core (15%).
I've spoken with the RDM Windows team again today; there were some technical issues with the 2026.2.12 build yesterday but they are confident it will be available tomorrow at the earliest, otherwise by Monday of next week.
Thanks again for your patience.
Kind regards,
Richard Markievicz
Hello
Thanks again for your patience.
RDM Windows 2026.2.12 has been released and I encourage you to update. It has specific fixes for this issue. No settings changes should be needed; just install the update and go; but please let me know if you're still experiencing issues after the upgrade.
Thanks and kind regards,
Richard Markievicz
Hello again,
I can confirm that after updating to version 2026.2.12, high cpu usage on Windows Server 2025 terminal returned to normal. I have tested it with default Avalonia Rendering settings also.
Thank you for your quick response and fix.
Hello
Thanks for the feedback and I'm glad things are working better. Please, if anyone else on the thread is still experiencing issues after the update to 2026.2.12, please don't hesitate to let me know.
Thanks and kind regards,
Richard Markievicz
Last Friday, I upgraded our environment (Devolutions Server and RDM) to the latest release. Following the upgrade, we observed increased CPU usage on our jump server (RDS). After installing Agent 2026.2.12, the issue appears to be resolved.
Thank you!
We can also confirm, that the issue is solved.
--
Citrix Technology Advocate (CTA) at https://www.meinekleinefarm.net
We got the chance to do the dot 12 update last night and things look MUCH better this morning as well. Thanks
Please do let us know your "how to avoid doing again" plan. The pain was certainly not as severe this time but due to the time until the remediation became available, my management team are interested to understand how we might be impacted in the future...
Hello,
We carried out the update (2026.2.12) on the evening of 29 June 2026.
The issue has also been resolved; please find attached the CPU usage graph for 29–30 June. The difference is striking !
We are also interested (like @brettpound ) in finding out what measures you will be putting in place to ensure the problem does not recur.
The impact on RDM usage has been significant.
Thank you.
Kind regards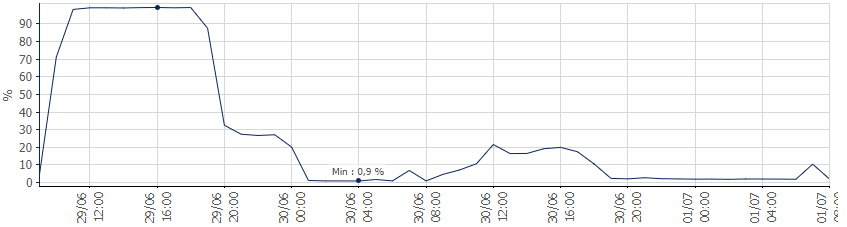
b43fd49c-b689-42ac-8a9a-6048c1c82c53.png
David here, CEO of Devolutions. I wanted to step in on this one personally. First, I'm glad it's now resolved in the latest version, and thank you all for your patience while we worked through it.
A bit of honest context. We are migrating RDM from WinForms, a technology from another era, to Avalonia, a modern UI framework. It is the right move for the product's future, but it also means we lean on third party components whose behavior we cannot always reproduce or detect from our own side. I won't promise nothing like this ever happens again, because we cannot recreate every customer environment, though we keep expanding what we can test against.
What I can promise is that we have engineers who genuinely care about getting it right, Richard and Carl in this thread being great examples, and they will always keep working hard. We are also lucky to have users like you who help us pin down problems we cannot see on our own. Expect us to lean harder on early detection and better tooling over the next releases, that is where a lot of our effort is going.
We care deeply about RDM and the people who rely on it every day, and that will not change. Keep the feedback coming.
Regards
David Hervieux
Hello
I wanted to follow David's post with some concrete information.
First, to explain what the actual issue was in this case. We're porting RDM's UI to Avalonia as David said; so 2026.2 got many existing screens and controls ported to that new framework. Avalonia uses skia for graphics and defaults to rendering with hardware acceleration. If the machine doesn't have a GPU (e.g. a terminal server), hardware accelerated rendering has to take an emulated software path (WARP) and in most cases, that's still fine for an application like RDM (something like a video game would obviously not work as well).
We're using a third party control for the circular "spinner" (progress) animation that gets shown when you're connecting a session. Unfortunately, what we found here, is that this control has exceptionally bad performance characteristics when rendered in software on certain machines. Taking the WARP (emulated 3D acceleration) could cause the control to take 50% of your CPU cores. Forcing Avalonia to use software rendering via skia (rather than hardware rendering that's then emulated on the CPU) drops that to about 15% of your CPU cores.
Then we hit a second issue: normally the progress is shown while needed, and then hidden. The expectation is that a hidden control no longer renders or animates and that's largely true, except again in the case of this specific control. The way that the control decides to draw its animation is done in a different way that means on the current Avalonia version, it continues to animate even when hidden. It's hard to say where the bug really lies there, but I did speak with the Avalonia team and they've corrected that behaviour in Avalonia 12 (which we will migrate to later this year).
So, in essence, there were two specific issues: a poorly performing control in certain environments, that quietly runs away with performance even when not displayed; and again, all of this only in certain environments (which is almost certainly related to the specific Windows version and driver combinations in some way).
The lowest hanging fruit to fix this was simply to identify the problematic uses of that control and ensure it's animation is stopped rather than just being hidden when needed. That immediately prevented the runaway CPU, but not the cost of actually using the control. So the remaining fixes look like this:
- We now detect a no-GPU environment at application launch
- If we're in such an environment, we force software rendering rather than emulated hardware rendering. One way is not strictly better than the other, except if cases such as this happen. So we just force the software path for safety now. This may need to be looked at again in future if we ever adopt any control that requires hardware rendering, but that's not the case right now and I don't envisage such a scenario in the future.
- If we're in such an environment, we proactively degrade or disable animations. This is generally better behaviour for an application running on a terminal server and now it's done automatically. So, if we have the same issue reoccur in future with a different control, it shouldn't affect these environments - the animation is already degraded or disabled for the environment.
The next part of my comments intertwines two ideas - why did it take so long to reach a resolution here, and what are we doing to prevent this happening again?
A little extra background: the was particularly unfortunate because as this thread shows we had a very similar problem with the 2026.1 release, in fact it appeared almost identical. Both of these issues required a very low-level of debugging to understand and both were inside third party components. In the 2026.1 case, it was caused by a bug in Yubico SDK which is source-available but needed in-depth analysis of the runtime behaviour of the application (if you're interested, you can read the analysis I gave to Yubico here). In this case, the same level of analysis was needed but also required decompiling the third party control library and understanding their code.
So, first we have the problem that this level of analysis requires knowledge of specific tools and processes that are not widely known outside of certain teams, and that was aggravated by the fact that we are in the summer and we have people on vacation and so on. Unfortunately since the issue looked so similar to the 2026.1 problem, that led the first-line support and developers along the wrong track to start with.
Last week our CTO has worked to provide extra tooling to all developers on the RDM team that simplifies the analysis process: all developers now have access to tooling that can ingest the runtime debug information from Windows, align it with the debugging symbols from the specific build and load that into their IDE as if they were debugging any "normal" issue on their workstation.
Next, I'm going to talk with the QA team this week and make sure that acceptance tests for RDM Windows cover running in a terminal server and specifically looking for high idle performance anomalies that they might not usually notice. This isn't a panacea - in both cases on this thread it was not easy for us to reproduce the issues, but it will add an extra line of defence.
The third part is that I will talk with our support team and ask them that if we get a similar report in future, the very first thing to do is to ask for runtime debug information from the customer to accelerate the analysis/fix/release cycle; even in the case where the issuer fundamentally appears the same as known or recurring problem.
And finally, as I said; I've added extra security to the application when running in such an environment to proactively disable or degrade features that might lead to this exact scenario again.
I hope this helps to understand the situation and that we do take this seriously. As David wrote, we cannot promise it won't happen again, but we (and I, personally) deeply care about such problems and are working hard to do better.
Please, let me know if something isn't clear or you have any other questions.
Kind regards,
Richard Markievicz
hi David and Richard,
thanks for stepping in - and stepping up. Your level of detail and explanation does reassure that this wasn't just a "simple oversight" of a really poorly performing update, but quite a swiss-cheese set of circumstances that caused this.
As one of the early people flagging this, I guess I could have fielded this differently as well - perhaps by not clouding the new issue with the previous by adding to this thread may have prompted a slightly different initial investigations on your side and perhaps faster identification of the real underpinning cause, but that wouldn't have alleviated the impact because of the time of year and personnel.
Again, great to see you both actively engaged here and throughout, and the open and frank discussion.