Activity Logs slow to open
After upgrading from 2024.2.19.0 to 2024.3.18.0 It takes over 1 minute to open Activity Logs.
If I test with the old client, it is almost instant.
Windows 11 23H2
RDM 2024.3.18.0 Licenced
Data source: Azure SQL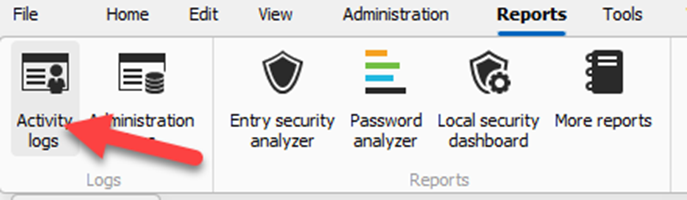
29ff5789-5971-4acc-acb4-568af0b6cf26.png
All Comments (11)
Hello acetico,
Thank you for reaching out.
I attempted to reproduce the issue you described but was unable to replicate it. I would recommend resetting the RDM local cache.
Please follow these instructions:
- Close Remote Desktop Manager.
- Navigate to %localappdata%\Devolutions\.
- Rename the RemoteDesktopManager file to any name of your choice.
- Reopen RDM and reconnect your database.
- Please test if the issue persists.
If you wish to revert these changes, you can simply delete the new RemoteDesktopManager file and rename the original one back to RemoteDesktopManager.
Should you need further assistance or have any additional questions, don’t hesitate to reach out.
Best regards,
Jacob Lafrenière
The issue remains unresolved when renaming the folder.
When attempting to replicate it, did you use a large database? Our database contains over 300 Vaults and 30,000 entries.
If I close and reopen the report, it still takes more than one minute to load.
Hello acetico,
Thank you for your prompt response.
Could you kindly confirm the number of DTUs available for your Azure SQL?
Additionally, I would greatly appreciate it if you could provide a Disk Usage by Top Tables report from your SQL server. For your reference, you can find detailed instructions on our documentation website: https://docs.devolutions.net/server/kb/troubleshooting-articles/en-dvls-performance-issues/.
If you prefer privacy, I would advise sending the report here: service@devolutions.net.
I look forward to assisting you with this matter.
Best regards,
Jacob Lafrenière
Using the old RDM client, the report opens in under 3 seconds on the same database. If only we have this issue, ignore it.
@acetico
When you have a minute, if you could perform the following so that I can analyze the cause of the issue.
- With RDM 2024.3.18 (or greater)
- Start the profiler
Help>Profiler
- Start the profiler
- Set the profiler level = 3
- Open the report
- Send us the profiler trace
- "Send trace to support" button
- Please add: Attn: Stefane in the subject.
Best regards,
Stéfane Lavergne
The trace is sendt.
Got the trace. I will analyze and get back to you soon.
Stéfane Lavergne
Here is the subset of your trace:
Global.GetLog...
    GetLog...
        --> SELECT * FROM dbo.ConnectionLog WHERE StartDateTimeUTC <= ? ORDER BY StartDateTime DESC : 58881 ms
        --> SELECT ID FROM dbo.Cache WHERE Name = @Name; : 89 ms
		...
        --> SELECT ID FROM dbo.Cache WHERE Name = @Name; : 12 ms
    GetLog : 85240 ms
    FilterUserSpecificSettings : 46 ms
    LoadConnectionLogList : 43 ms
Global.GetLog : 85334 ms
In this case, it took 1m 25s to open the window. 58s of that was just fetching the data from the server. I will investigate what happens in the other +25s after the initial fetch.
My first guess is that the number of logs is just very, very high. I would suggest you clean them on a regular basis so that it doesn't get out of hand. (see here)
But before you clean them out, could you please send me your schema? I would like to validate the assumption (row count) but also confirm that all the proper indexes exist in your database.
Steps:
- File > Data Sources > Upgrade (tab) > Email schema to support.
- Please add "attn: Stefane" to the subject.
Best regards,
Stéfane Lavergne
Also, if you could provide me with a screenshot of the report window once it loads, I would appreciate it.
I would like to see the options you have configured by default and the count of rows returned. I can't quite figure out how the trace provided the information it did. The screenshot might help.
Thanks!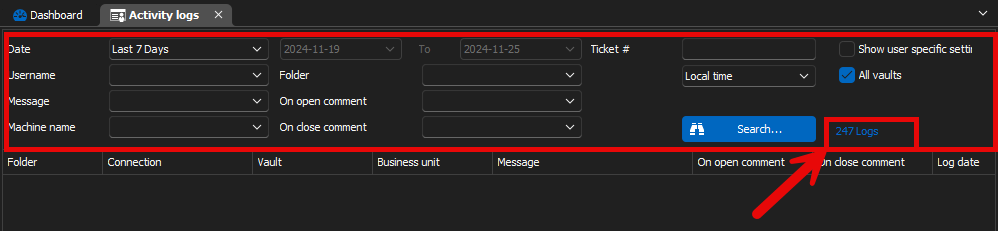
Stéfane Lavergne
d9f16451-527b-44f5-ab04-3b5ed40ef36d.png
I received your schema, and everything looks perfect there. The ConnectionLogs table contains almost 1.6M rows, so a cleanup would be beneficial.
The good news is that I was able to reproduce the issue on my end, and I will be implementing a fix.
In the meantime, if you limit the number of rows, the reports may open with "Last 90 days" or something similar. You could try setting it to "Last 7 days" to see if that helps, or even "Today," until we can deliver the fix to you.
Best regards,
Stéfane Lavergne
These are the settings I typically use when accessing Activity logs, take over a minute to load.
When this setting is applied, accessing the Activity logs continues to take over a minute.
If the new RDM version loads all logs into cache when accessing Activity logs, please add a checkbox to choose whether to load all logs. While this might be useful in some cases, it is not suitable for us.
