Cyberark Dashboard no longer working after update
I upgraded to 2024.1.17.0 64-bit today and my Cyberark Dashboard which was previously working will no longer allow me to connect to any targets. I am able to successfully authenticate to Cyberark and can see my safes and accounts, but the 'Connect' button is grayed out in the dashboard. I can no longer use the option to double click to connect via dashboard, nor do I see a 'Connect Using' menu when right clicking on a host.
When editing the dashboard, I noticed that within the 'PVWA' tab, the Connection Components box is no longer present.
All Comments (17)
Hello Michael,
Thank you for reaching out to us regarding this,
I saw that you also created a case regarding this,
I've reached out to you via email directly
Best regards,
Samuel Dery
Hi Michael!
I believe we might have inadvertently broken compatibility with previous version of CyberArk. To confirm this, could you tell me what is the version of your CyberArk? You should be able to see this in the footer of the CyberArk web dashboard:
Also, if it's not a bother to you. Could you connect via said web dashboard and make a small test for me? What I'd like you to do is:
- Authenticate
- Open your browser console (F12 on Firefox and Chrome)
- Select the Network tab
- Perform a search in the Safe field
- Take note of the request being made in the network tab and share this information with us
Here's a screenshot showing what I mean:
Best regards,
Xavier Fortin
CyberArkWeb.png
CyberArkFooter.png
Hi Xavier,
We are on version 13.2 of the privilege cloud service.
When I go to the Accounts View, I do not have a separate text box to search a specific safe. All I have is the 'Search for accounts' text box. 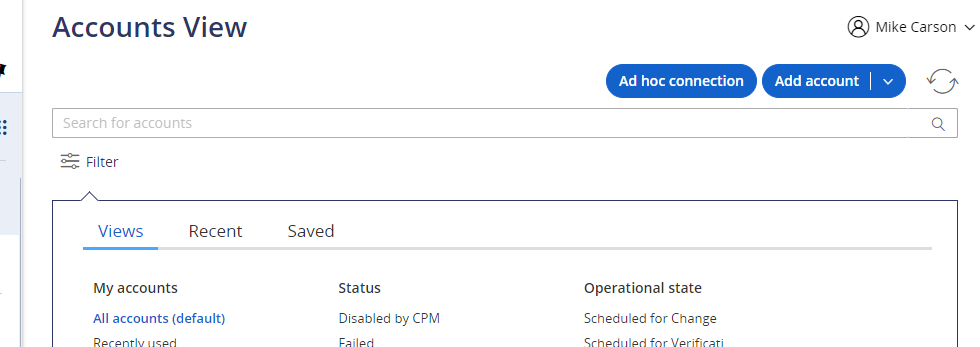
4b09822a-51c7-4511-a746-20212acfc707.png
Interesting. Can you still follow the step I outlined earlier, but instead of searching for a vault, just press the refresh button (the two arrows in a circle one). I'd still be interested to see what request is made. Also, if you could then select the request in the list, select the response tab and checking the Raw button, like this: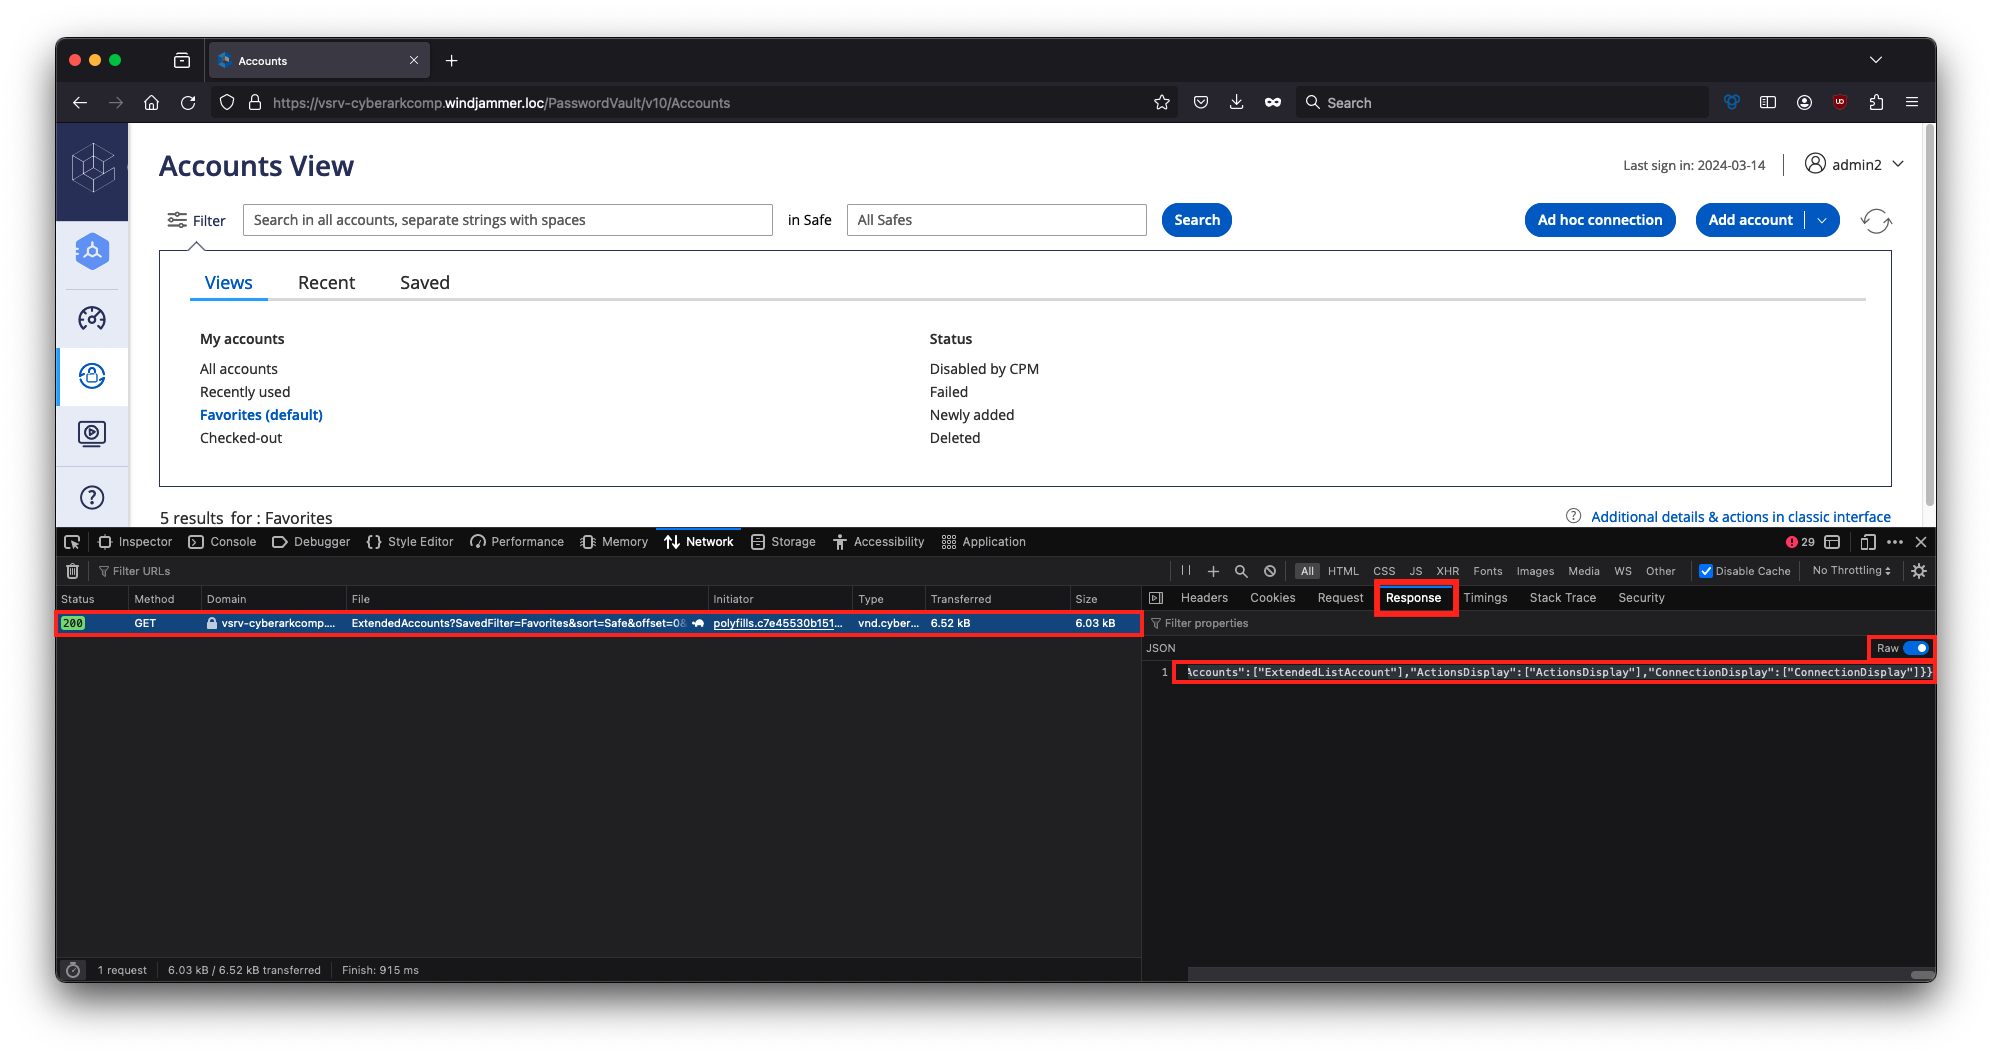
You can then send me the Response to my email: xfortin@devolutions.net. There shouldn't be any sensitive information, only surface information on the account, but I still recommend going over it and redact any information you do not want to share. You can also restrict the result of the research by making a search that narrows the result to a single (or a few) accounts, making reviewing the information easier.
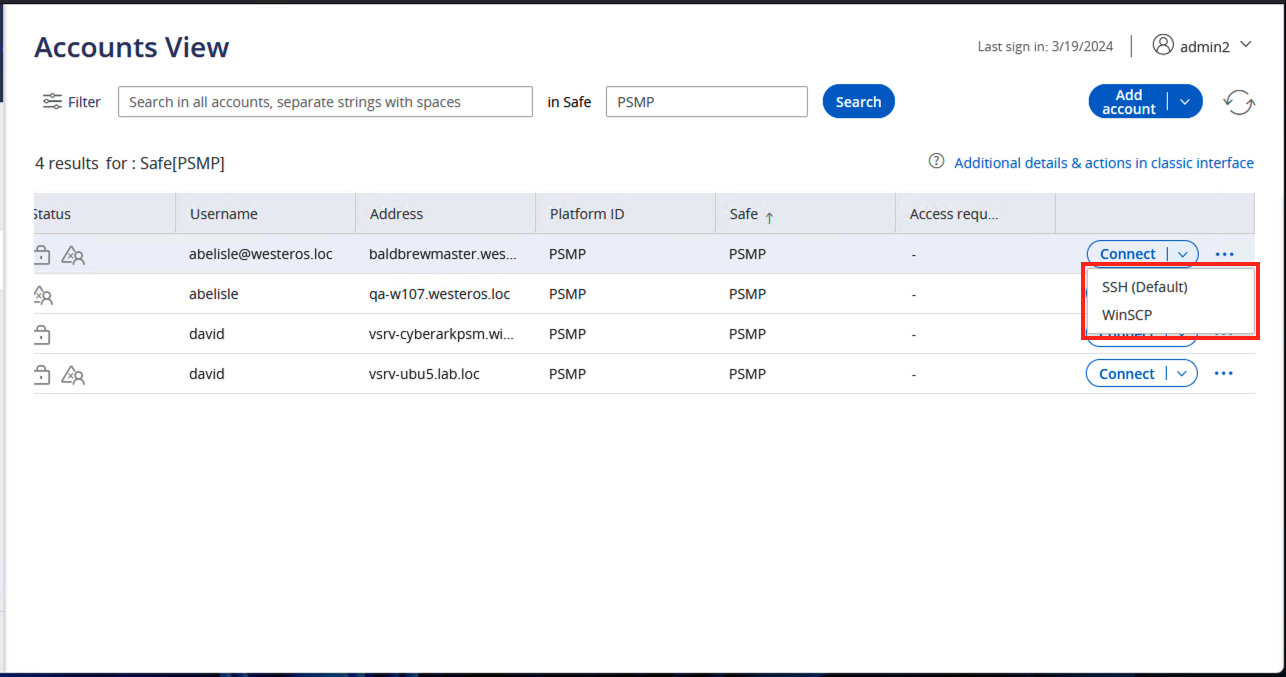
Another thing that would help me is to know what the "Connect" section looks like on one of the accounts. For instance, in my case: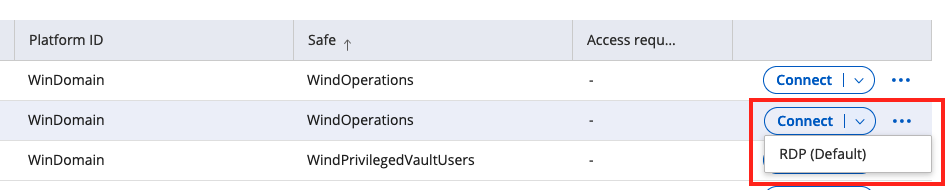
Best regards,
Xavier Fortin
Connect.png
RequestResponse.png
Hi Michael,
I believe your issues should be fixed in the next release of RDM Windows (2024.1.18.0). Both the issue with favorite accounts and the error you got when switching to another safe.
If the issue nonetheless persist, or any other behavior changed, do not hesitate to post back!
Best regards,
Xavier Fortin
Thank you!
I see that 2024.1.18 was released today. I installed it, but my issue persists. I can connect to the Cyberark dashboard, but I do not see any 'Connect' button in the dashboard nor can I right click a host and choose 'Connect Using'. Also the connection components are still missing from the Dashboard properties > Advanced > PVWA
Hi Michael!
Sorry about that.
That being said, I do not quite reproduce. Are we still talking about the Favorites tab only? In my case, they show the same components I would see if I used the CyberArk web dashboard. See: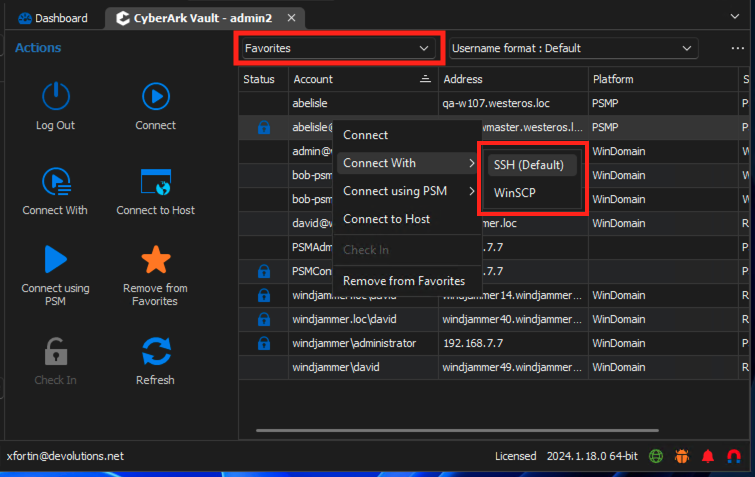
Are you getting a different result directly from the CyberArk dashboard?
As for:
Also the connection components are still missing from the Dashboard properties > Advanced > PVWA
This is normal, we've switched to dynamically fetch the components from CyberArk directly, to better emulate the way their dashboard works, and so, we technically do not need a static list of components.
Best regards,
Xavier Fortin
CyberArk.png
RDM.png
Xavier,
When I right-click on an account whether it be in Favorites or in 'Show All', all I receive is 'Add to Favorites'. Also there is no other buttons available in the Actions panel.
Here is an example. This account has several connection components in use. 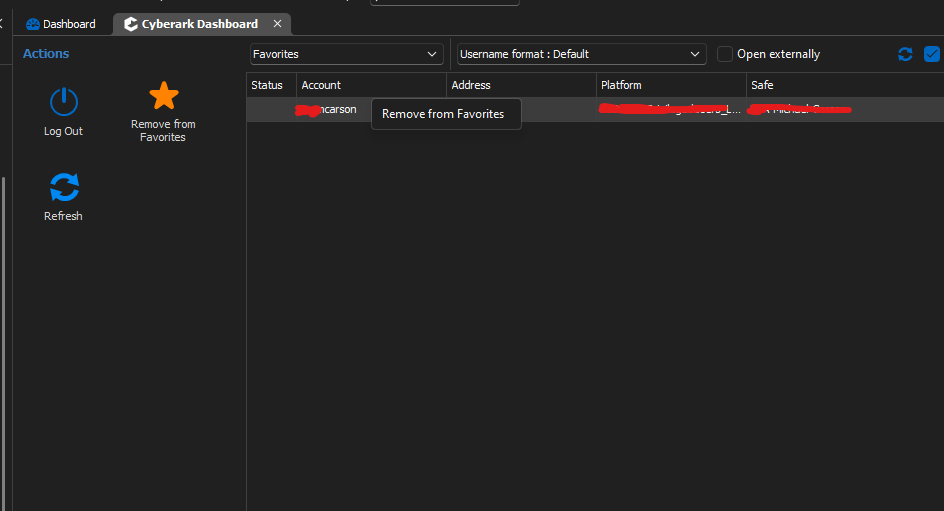
5a9b3eb1-cdc8-4a2b-8dbc-9a6544eefada.png
Did you perhaps uncheck "Allow direct connection (PVWA)" checkbox in your dashboard settings?
Here is the setting in question: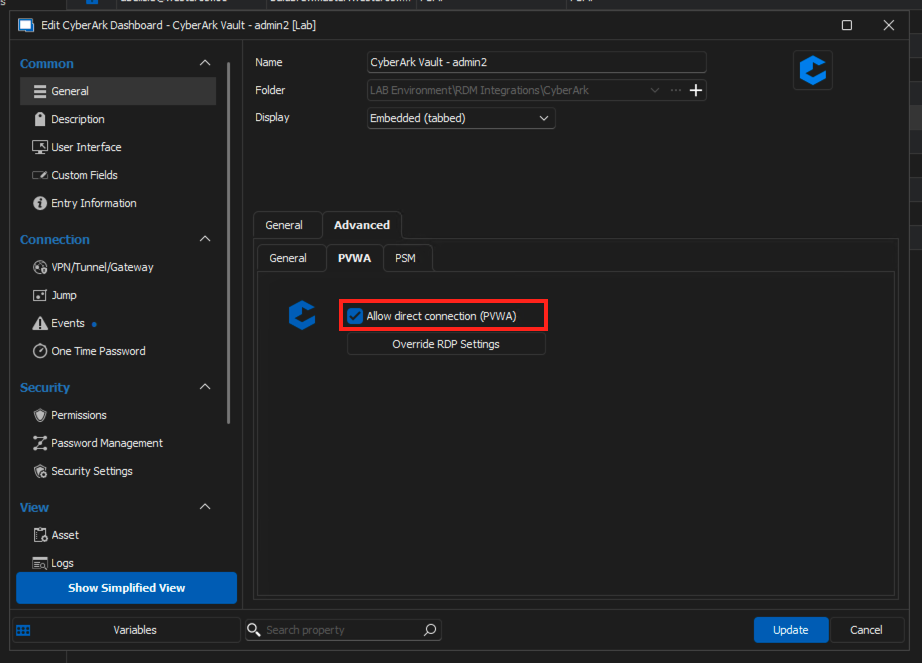
This is the only thing I can imagine causing the Connect button to be hidden (otherwise it should at least be visible, even if disabled).
Best regards,
Xavier Fortin
AllowPVWA.png
Xavier,
Ok, I did not have that checked. It must have not been checked from my previous configuration. I had not changed any settings on the dashboard before the update. Once I checked it, I had to restart RDM. After that, I am able to pull up the connection components and connect normally.
Ouff... I was worried there for a moment 😅
Am I right in assuming that this resolves your issue?
In any case, if you have any other issues, please, do not hesitate!
Best regards,
Xavier Fortin
Yes, this is now resolved. I ran through all my normal tasks and it looks good! Thanks!
Glad to hear it!
Best regards,
Xavier Fortin
Ouff... I was worried there for a moment 😅
Am I right in assuming that this resolves your issue?
In any case, if you have any other issues, please, do not hesitate!
Best regards,
I have encountered another bug with favorites:
I have an account in favorites, when I click the connect button in the dashboard, I cannot type in a host to connect to.(it will not accept any input), nor do I see the folder view. 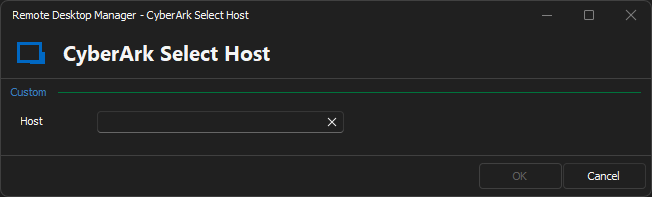
However, when I choose 'Show All' and select the same account in the full account list and choose Connect, I can type in a host and also see the folder view: 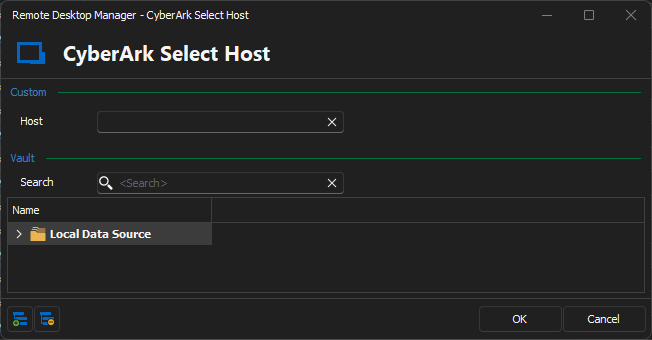
669356b6-4599-40eb-a415-95eaa2e44970.png
213a643f-b05e-4120-bd75-13b309cccd38.png
Hi Michael,
We have a ticket of a very similar issue already opened. I'll attach it to this thread and we will see if the eventual fix works for you.
Best regards,
Xavier Fortin
Hi Michael,
I believe I have found the issue, you can expect a fix in the next release of RDM Windows (2024.1.20.0).
Do tell me if the issue persists after updating.
Best regards,
Xavier Fortin