measuring responsiveness of RDM
we run a mysql database for our on premises RDM.
we would like to setup a test that runs a query on the database every 5 minutes to measure how long it takes to respond.
over time we will graph the response time to get an understanding of the responsiveness of the database from the perspective of the RDM user.
does anyone have any suggestions on what query would be a reasonable measure?
and example query might be to count the number of configurations stored in the database.
it should always have an answer
this would exercise the database and
possibly give an indication of the effort needed by the database to find connection configuration details
the query should be read only.
the query should not be so big that it affects interactive performance.
RDM users will have access to the measurement history and after this has been running for a month we will set a threshold which is an indicator that performance is lower than desirable. this can be an indicator of a technical issues with the infrasturcture or resource capacity. it is better to have some measure that represents the user experience so we can address any underlying issue and it gives a measure users can relate to.
the answer we are looking for is actual sql queries or some query through an api
we dont have any issues with RDM but one of our staff was reporting resonsiveness issues working from home so a local test in our data centre would also indicate if it is running well in the data centre but the remote user has a connectivity problem they need to diagnose.
thank you in advance.
All Comments (1)
Hi,
Your best bet here would be to run the profiler in RDM to give you an idea of the responsiveness of a given client at a given time.
The profiler with Profile Level set to (3) will also output the SQL statements and execute time of each statement. You could then use one of those to perform your monitoring.
Tips on performance, make sure the client is configured to use the RDM's caching mechanism (File > My Data Source Information).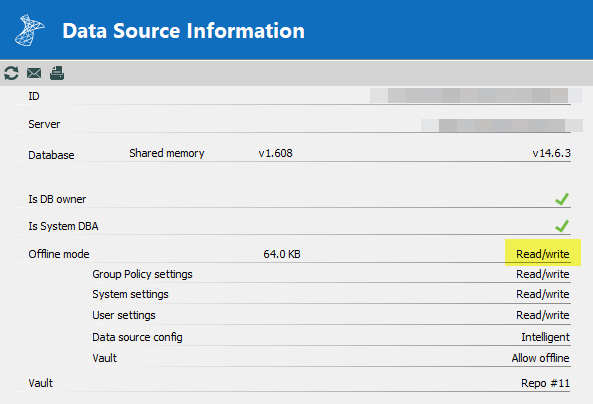
Once you've validated that the client caching is enabled (not "Disabled" any of "Read/Write", "Read-Only" or "Cache-Only" are good).
Open profiler (Help > Profiler) and set the "Profiler level = 1" to start, if your refresh data source (top left "refresh" button). You should see something like this:
Main thread (UI)
----------------------------------------
reload: False hasSecurityChanged: False hasChanged: False
LoadConnections [Sample Data Source]...
    ClearConnections : 0 ms
LoadConnections [Sample Data Source] : 195 ms
You will notice that nothing much happened .Why? The client cache was already up-to date. So there was no "real" data to get from the server.
Now try CTRL + "refresh" button, this has for effect to flush the client cache and do a full refresh. Result should look something like this:
Main thread (UI)
----------------------------------------
LoadConnections [Sample Data Source]...
    ClearConnections - dispose : 0 ms
reload: True hasSecurityChanged: True hasChanged: True
    HasOfflineChanges : 0 ms
    ClearConnections - dispose : 0 ms
    LoadConnectionsFromDataSource...
        LoadDataSourceSettingsFromDataSource...
            GetDataSourceSettings : 3 ms
        LoadDataSourceSettingsFromDataSource : 3 ms
        GetConnections...
            Database.GetConnections...
                Reading connections from database : 193 ms
                DecryptData : 29 ms - Count : 190
                DeserializeData : 9 ms - Count : 190
            Database.GetConnections : 246 ms
        GetConnections : 246 ms
        DoMergeConnections...
            PrepareConnectionList : 0 ms
            Loop...
                Initialize : 0 ms
                Migrate Connection : 0 ms
                OfflineManager.Merge : 0 ms
                Merge With List - Contains : 0 ms
                Merge With List : 0 ms
            Loop : 0 ms
            Merge Full List...
                Offline : 1 ms
                Connections : 0 ms
            Merge Full List : 1 ms
            Filter : 0 ms
            ClearConnections : 0 ms
        DoMergeConnections : 2 ms
    LoadConnectionsFromDataSource : 267 ms
    ClearConnections : 0 ms
LoadConnections [Sample Data Source] : 465 ms
Connection States: Refresh...
    ClearClosedRunning : 0 ms
    GetAllConnectionStates : 2 ms
    HasChanges : 0 ms
Connection States: Refresh : 2 ms
TreeView.LoadConnectionList...
    GetGroupInfos : 0 ms
    BeginUpdate...
        LoadConnectionInTreeNode : 2 ms
        PreCreateGroups : 0 ms - Count : 1
    BeginUpdate : 5 ms
TreeView.LoadConnectionList : 5 ms
SelectionChanged...
    LoadConnectionList : 0 ms
    LoadConnectionList : 0 ms
SelectionChanged : 191 ms
Find the lines
        GetConnections...
            Database.GetConnections...
                Reading connections from database : 193 ms
                DecryptData : 29 ms - Count : 190
                DeserializeData : 9 ms - Count : 190
            Database.GetConnections : 246 ms
        GetConnections : 246 ms
and
LoadConnections [Sample Data Source] : 465 ms
So it took 246 ms to get 190 sessions from the server with a total of 465 ms to fetch + process the data (246 ms + 219 ms)
CTRL forced a full refresh (worst case) now this shouldn't happen (much) in a real world scenario. What you would actually see is a middle ground, where some changes have been made and only those are being synced.
Using a second RDM I performed 1 edit, 1 add & 1 delete. Here is the result of the first RDM when I performed a refresh (normal refresh not forced):
Main thread (UI)
----------------------------------------
reload: False hasSecurityChanged: False hasChanged: True
LoadConnections [Sample Data Source]...
    HasOfflineChanges...
        HasOfflineSessionChanges : 0 ms
    HasOfflineChanges : 0 ms
    OfflineManager.GetDataSourceSettings : 1 ms
    LoadConnectionsFromDataSource...
        LoadDataSourceSettingsFromDataSource...
            GetDataSourceSettings : 1 ms
        LoadDataSourceSettingsFromDataSource : 1 ms

        GetConnections...
            Database.GetConnections...
                Reading connections from database : 0 ms
                DecryptData : 0 ms - Count : 2
                DeserializeData : 0 ms - Count : 2
            Database.GetConnections : 5 ms
        GetConnections : 5 ms
        DoMergeConnections...
            PrepareConnectionList : 0 ms
            Loop...
                Initialize : 0 ms
                Migrate Connection : 0 ms
                OfflineManager.Merge : 0 ms
                Merge With List - Contains : 0 ms
                Merge With List : 1 ms
            Loop : 1 ms
            Filter : 0 ms
            ClearConnections : 0 ms
        DoMergeConnections : 1 ms
    LoadConnectionsFromDataSource : 12 ms
    ClearConnections : 0 ms
LoadConnections [Sample Data Source] : 44 ms
Connection States: Refresh...
    ClearClosedRunning : 0 ms
    GetAllConnectionStates : 0 ms
    HasChanges : 0 ms
Connection States: Refresh : 0 ms
TreeView.LoadConnectionList...
    GetGroupInfos : 0 ms
    BeginUpdate...
        LoadConnectionInTreeNode : 0 ms
        PreCreateGroups : 0 ms - Count : 1
    BeginUpdate : 4 ms
TreeView.LoadConnectionList : 4 ms
SelectionChanged...
    LoadConnectionList : 0 ms
    LoadConnectionList : 0 ms
SelectionChanged : 379 ms
Look at the same section as before, notice that only 2 sessions were sent (plus the deleted one) and the client was synced and is now up-to date with the server and only took 44 ms to perform the action.
How about your question? What SQL can you profile. If you set the "Debug level = 3" it will output the SQL statements while profiling.
I would use the third case (most common) and execute that query on a regular basis for you. Look for a query that looks like the following:
select c.ID, c.Data, c.SecurityGroup , c.AttachmentCount, c.AttachmentPrivateCount, c.TodoOpenCount, c.HandbookCount from dbo.Connections c where ISNULL(c.RepositoryID, @DefaultRepositoryID) in (@RepositoryID, @GlobalRepositoryID) and c.Version > @Version;select ch.ConnectionID as ID, ch.ConnectionType, ch.SecurityGroup, ch.GroupName, ch.RepositoryID from dbo.ConnectionHistory ch where ch.Version > @VersionDeleted and ((ch.HistoryType = 'D' and ISNULL(ch.RepositoryID, @DefaultRepositoryIDch) in (@RepositoryIDch, @GlobalRepositoryIDch)) or (ch.HistoryType = 'M' and ISNULL(ch.RepositoryID, @DefaultRepositoryID2ch) not in (@RepositoryID2ch, @GlobalRepositoryID2ch)));select max(Version), @@DBTS from (
    select max(c.Version) as Version from dbo.Connections c where  ISNULL(RepositoryID, @DefaultRepositoryID) in (@RepositoryID, @GlobalRepositoryID)
    union all
    select max(c.Version) as Version from dbo.ConnectionHistory c where ISNULL(RepositoryID, @DefaultRepositoryID) in (@RepositoryID, @GlobalRepositoryID)
    union all
    select max(c.Version) as Version from dbo.ConnectionHistory c where ISNULL(RepositoryID, @DefaultRepositoryID) <> @RepositoryID and HistoryType = 'M'
) a;select ID, Name, ImageBytes, ImageName, IsAllowedOffline, RepositorySettings from dbo.Repository where ID = @RepositoryExistsID;
    @DefaultRepositoryID:00000000-0000-0000-0000-000000000000
    @RepositoryID:cc6572f5-f37d-463b-ac4e-eef5cb3cc6d1
    @GlobalRepositoryID:00000000-0000-0000-0000-000000910ba1
    @Version:0x0000000000096E13
    @VersionDeleted:0x0000000000096E13
    @DefaultRepositoryIDch:00000000-0000-0000-0000-000000000000
    @RepositoryIDch:cc6572f5-f37d-463b-ac4e-eef5cb3cc6d1
    @GlobalRepositoryIDch:00000000-0000-0000-0000-000000910ba1
    @DefaultRepositoryID2ch:00000000-0000-0000-0000-000000000000
    @RepositoryID2ch:cc6572f5-f37d-463b-ac4e-eef5cb3cc6d1
    @GlobalRepositoryID2ch:00000000-0000-0000-0000-000000910ba1
    @RepositoryExistsID:cc6572f5-f37d-463b-ac4e-eef5cb3cc6d1
This is the most import (often executed) query that RDM performs. I've modified the query, simply replace the first two values with the values from your profiler output
DECLARE @RepositoryID uniqueidentifier = 'cc6572f5-f37d-463b-ac4e-eef5cb3cc6d1';
DECLARE @Version binary(8) = 0x0000000000096E13

DECLARE @DefaultRepositoryID uniqueidentifier = '00000000-0000-0000-0000-000000000000';
DECLARE @GlobalRepositoryID uniqueidentifier = '00000000-0000-0000-0000-000000910ba1';

select c.ID, c.Data, c.SecurityGroup , c.AttachmentCount, c.AttachmentPrivateCount, c.TodoOpenCount, c.HandbookCount from dbo.Connections c where ISNULL(c.RepositoryID, @DefaultRepositoryID) in (@RepositoryID, @GlobalRepositoryID) and c.Version > @Version;

select ch.ConnectionID as ID, ch.ConnectionType, ch.SecurityGroup, ch.GroupName, ch.RepositoryID from dbo.ConnectionHistory ch where ch.Version > @Version and ((ch.HistoryType = 'D' and ISNULL(ch.RepositoryID, @DefaultRepositoryID) in (@RepositoryID, @GlobalRepositoryID)) or (ch.HistoryType = 'M' and ISNULL(ch.RepositoryID, @DefaultRepositoryID) not in (@RepositoryID, @GlobalRepositoryID)));

select max(Version), @@DBTS from (
    select max(c.Version) as Version from dbo.Connections c where  ISNULL(RepositoryID, @DefaultRepositoryID) in (@RepositoryID, @GlobalRepositoryID)
    union all
    select max(c.Version) as Version from dbo.ConnectionHistory c where ISNULL(RepositoryID, @DefaultRepositoryID) in (@RepositoryID, @GlobalRepositoryID)
    union all
    select max(c.Version) as Version from dbo.ConnectionHistory c where ISNULL(RepositoryID, @DefaultRepositoryID) <> @RepositoryID and HistoryType = 'M'
) a;

select ID, Name, ImageBytes, ImageName, IsAllowedOffline, RepositorySettings from dbo.Repository where ID = @RepositoryID;
There is a lot of information here, I hope this helps you get started. Let me know if you have a specific question.
Best regards,
Stéfane Lavergne
2020-04-17_7-13-28.png