Show System Status in Device Dashboard from external Monitoring system like PRTG
Show System Status in Device Dashboard from external Monitoring system like PRTG
0 vote
In the Dashboard of an Device / Object it would be awesome to show the live status of the system provided from an monitoring system like PRTG.
So an administrator gets a direct view of the system status without the need to have a separate look at the monitoring system, when administration servers.
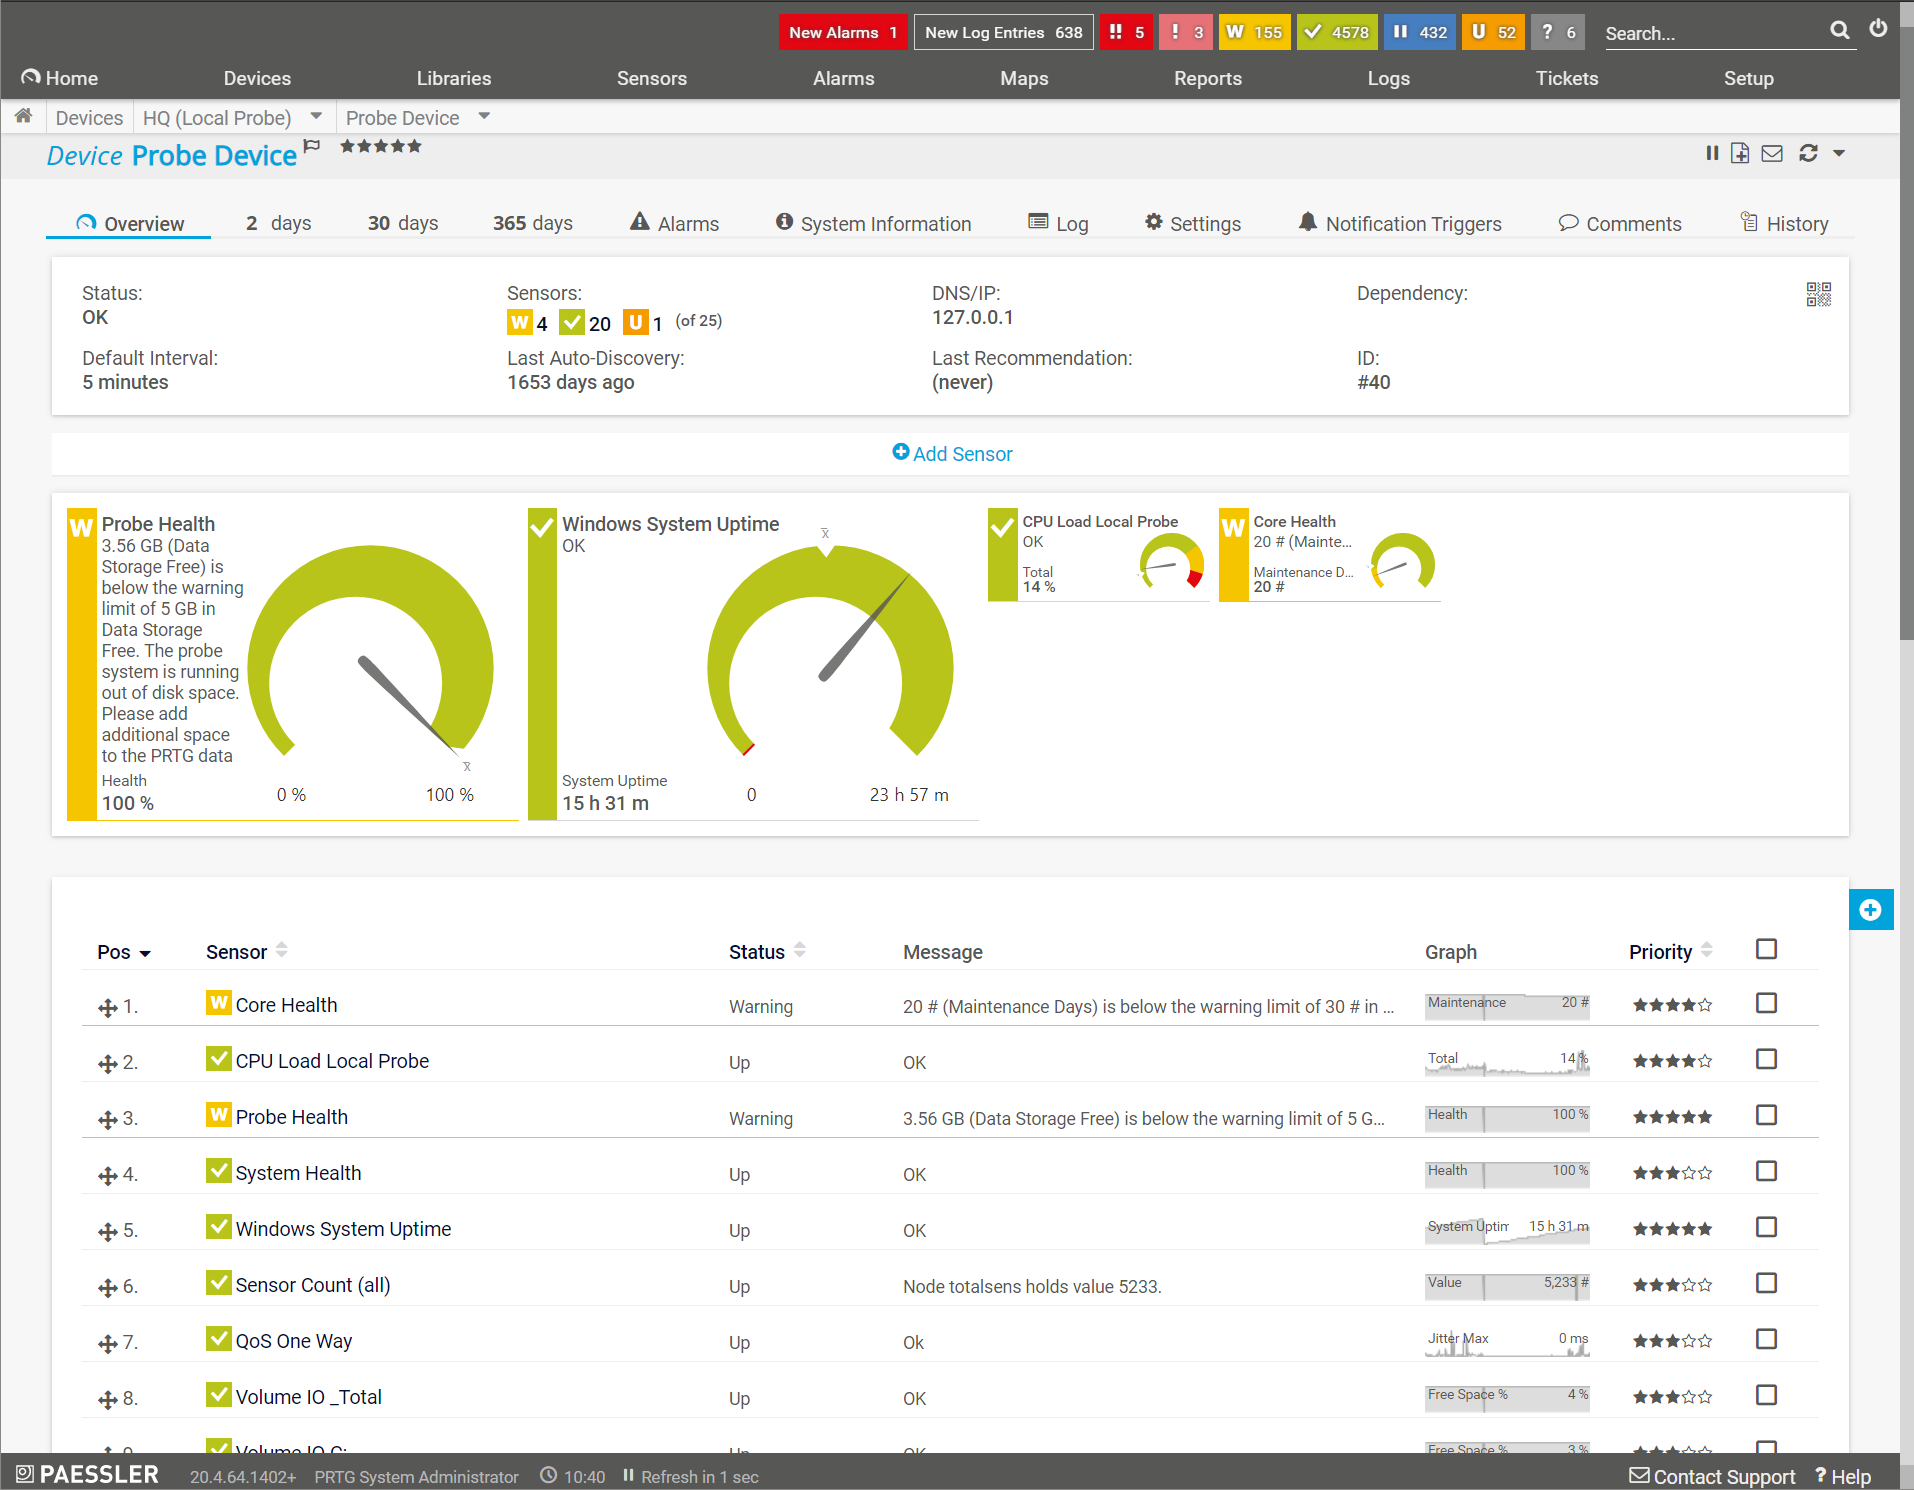
In special PRTG provides an huge api with connections to sensor data, aswell as graphs - which could be embedded in Remote Desktop Manager. It's documented here:
https://www.paessler.com/manuals/prtg/application_programming_interface_api_definition
Maybe this is also possible with an already included function? If not, it would be awesome to have some guys of you thought about it ;-)
Kind regards,
Constantin
All Comments (6)
Hello,
For now there is no plan for such integration but I will verify what can do.
Regards
David Hervieux
Hi David,
any updates on this? This where very useful for us, too!
Thanks,
DavidW
Hello,
Do you know if could embed an url with the details instead of doing an integration?
Regards
David Hervieux
Unfortunately not. The URL always contains a UID like device.htm?Id=18357 and the call requires authentication.
While with Check_MK it would be possible to integrate in several ways:
With an url of the service overview of one host: https://checkmkcheck_mk/view.py?deployment_last_contact_from=&deployment_last_contact_until=&deployment_last_download_from=&deployment_last_download_until=&deployment_last_registered_from=&deployment_last_registered_until=&filled_in=filter&host=HOSTNAME&host_last_check_from=&host_last_check_until=&host_last_state_change_from=&host_last_state_change_until=&selection=b735fecc-4cbe-40ec-86b8-b4329d46069d&svc_last_check_from=&svc_last_check_until=&svc_last_state_change_from=&svc_last_state_change_until=&view_name=host
The same data could also be fetched as json with &output_format=json
 [
  "OK",
  "Filesystem C:/",
  "themes/modern-dark/images/icon_menu Buch themes/modern-dark/images/icon_pnp outof_serviceperiod",
  "OK - 64.54% used (25.46 of 39.45 GB), trend: +16.67 MB / 24 hours",
  "2019-10-19 17:32:10",
  "2020-07-30 23:47:54",
  "64.54%"
 ],
 [
  "OK",
  "Filesystem E:/",
  "themes/modern-dark/images/icon_menu Buch themes/modern-dark/images/icon_pnp outof_serviceperiod",
  "OK - 70.38% used (70.5 of 100.17 GB), trend: 0 B / 24 hours",
  "2019-10-19 17:32:10",
  "2020-07-30 23:47:54",
  "70.38%"
 ],
 [
  "OK",
  "HTTPS SSL-Zertifikat-443",
  "themes/modern-dark/images/icon_menu Buch outof_serviceperiod",
  "OK - Certificate 'Unknown CN' will expire on Fri Mar 18 10:28:28 2022 +0000.",
  "2020-07-15 05:12:45",
  "2020-07-30 23:47:27",
  ""
 ],
Is it possible to add an tab in the overview with an url ? I've looked into the settings but didnt found sth. though. 
Kind regards,
Constantin
Hello,
Thank you for contacting us on that matter!
To achieve something similar, I would recommend the use of the "Home Page" in the properties of your entries:
In this section, it is possible to add an URL that will be shown in the "Overview" tab of your Dashboard when this entry is selected:
I hope that helps!
Best regards,
James Lafleur