Interactive PingCastle dashboard
Simple use case.
PingCastle is an open source Active Directory Auditing tool, to find weaknesses in your AD’s.
I run a report weekly, to track progress, and find new issues.
While the reports themselves are ok-ish. having charts to display data just makes stuff better.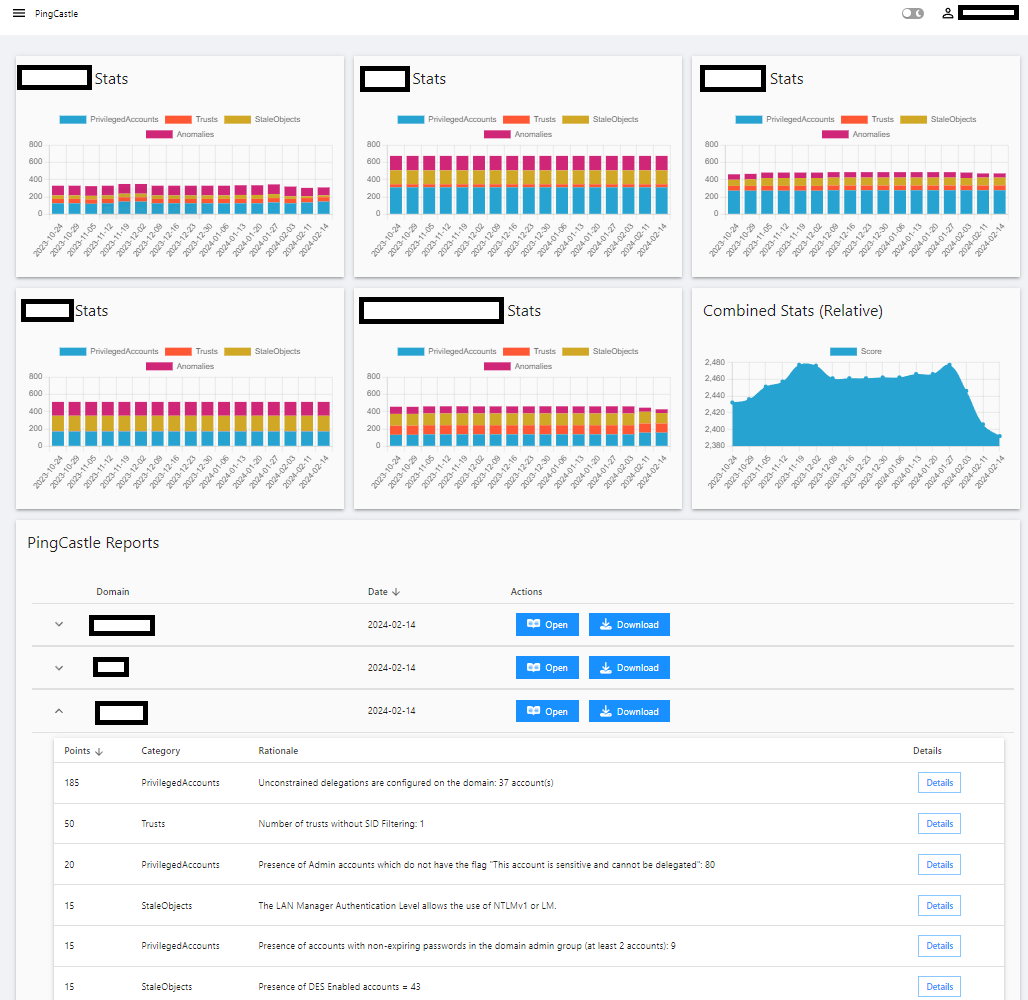
To retrieve numbers from the generated XML, I use this function
function Get-PingCastleXMLRuleData {
    param(
        [string]$XMLfilepath
    )
    if(test-path $XMLfilepath){
        [XML]$CurrentReport = get-content $XMLfilepath
        $CurrentReport.HealthcheckData.RiskRules.HealthcheckRiskRule | ForEach-Object {
            [pscustomobject]@{
                Points    = $_.Points
                Category  = $_.Category
                Model     = $_.Model
                RiskId    = $_.RiskId
                Rationale = $_.Rationale
                Details   = $_.Details.string
                Sourcepath = $XMLfilepath
                SourceDomain = $CurrentReport.HealthcheckData.DomainFQDN
            }
        }
    }
    else{
        write-error "Path not found"
    }
}
in the HTML report we can find the description and problematic objects, but parsing the reports can be a little icky.
I used the code below to run through all my old reports, and a variations hereof in my script the generate reports.
$PingReports = Get-ChildItem .\Reports -Recurse -Include "*.xml"

Foreach($PingReport in $PingReports){

    $HTMLFile = (Get-item $(($PingReport.DirectoryName) + "/" + $($PingReport.BaseName) + ".HTML"))
    $HTMLFileFolder = Get-item $HTMLFile.Directory

    [XML]$CurrentReport = get-content $PingReport

    New-Item -ItemType Directory -Path $HTMLFileFolder -Name $CurrentReport.HealthcheckData.DomainFQDN -ErrorAction SilentlyContinue
    $detailspath = $HTMLFileFolder.FullName + "\" + $CurrentReport.HealthcheckData.DomainFQDN
    New-Item -ItemType Directory -Path $detailspath  -Name "Details" -ErrorAction SilentlyContinue

    $source = Get-Content $HTMLFile -Raw
    $html = New-Object -ComObject "HTMLFile"
    $src = [System.Text.Encoding]::Unicode.GetBytes($source)
    $html.write($src)
    foreach ($Riskrule in ($CurrentReport.HealthcheckData.RiskRules.HealthcheckRiskRule.riskid)){
        $divId = "rules$Riskrule"

        $div = $html.getElementById($divId)
        $div.innerHTML # save this how you like - i store them in a date based folder structure as $Riskrule.html

    }
}
The “innerhtml” is displayed directly in a modal when clicking the Details button.
da0be974e26a9ba1aa1cc084fe0afb9fa9a454eb.png
All Comments (4)
Where can i learn more about his product?
PingCastle?
Home - PingCastle
its an open source Active directory “Risk analyzer/Audit” tool.
you don’t need any special rights to run it. Just download it to a domain joined pc and run it.
PingCastle.exe --healthcheck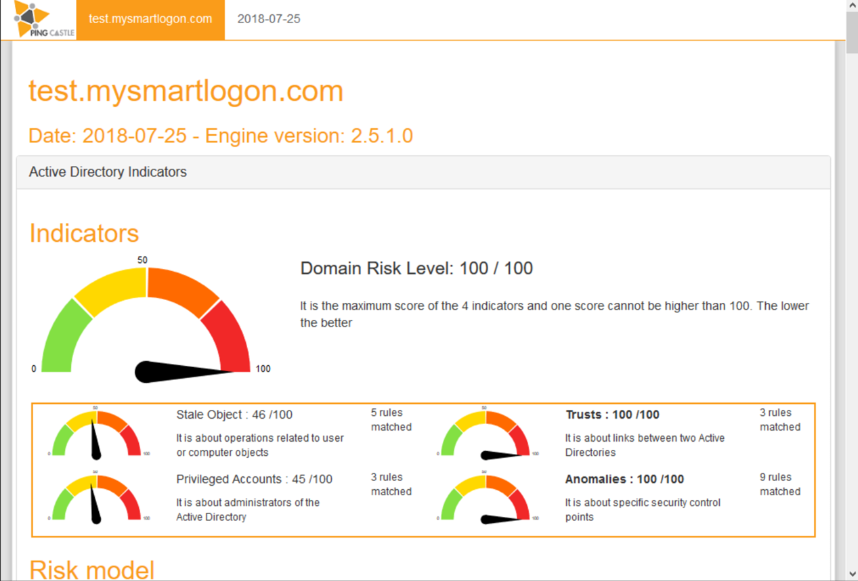
I initially build the dashboard because the report charts only go to 100 even if the score is higher - which means initial progress may not be visible to higher-ups.
8ab9bb52fb5c94f89c3fd784154905e0665d689a.png
@AnonymousUser , Thank you for this.
Been a while, and a couple of changes has since made its way to the dashboards.
higher ups has taken an interest in the progress of hardening our AD’s, which is where Powershell universal really shines.
A few months back I started parsing the XML to store the data from each report in a database. Doing this allowed me to easily figure out the differences between the current, and last weeks batch of reports. this was used to show a numerical “score reduction this week” and even better, a detailed list of RiskRule changes.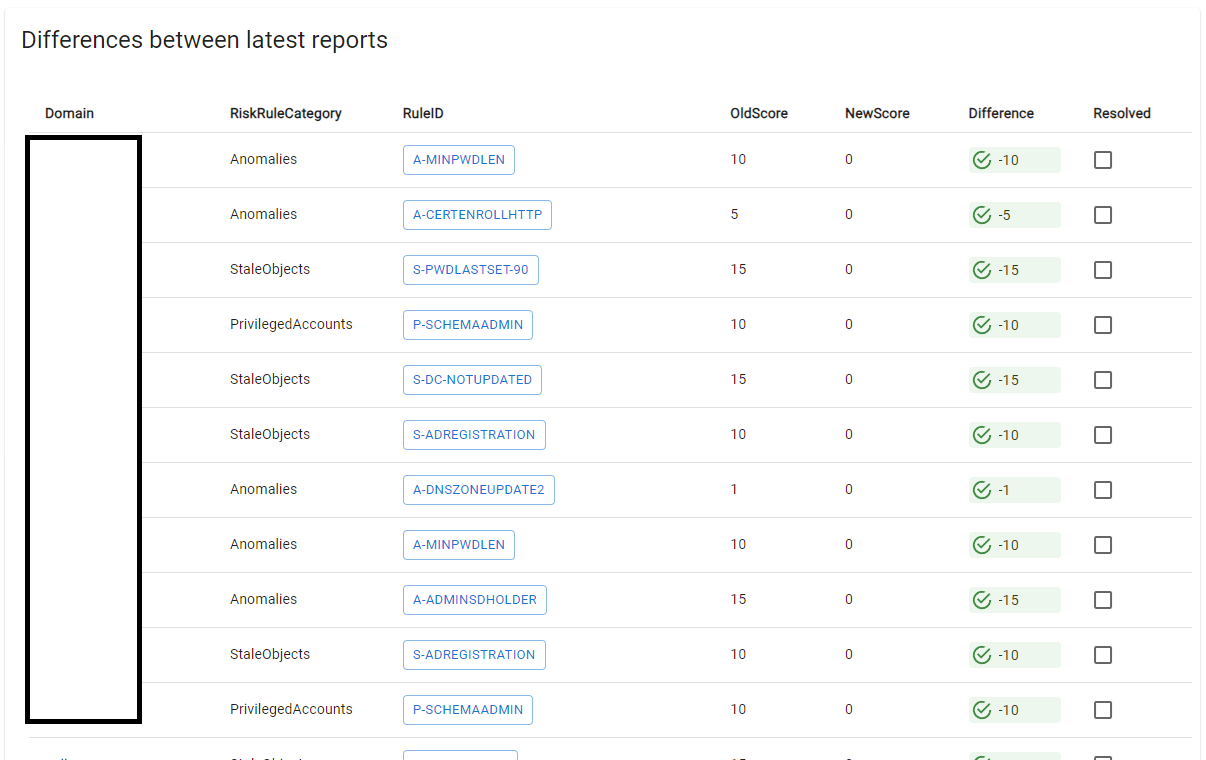
For “negative” changes (as in something that caused the score to increase), I added the option to check a box to show if it has been handled - Ideally nothing would get worse, but that’s life and this way we can show that we put in the effort to fix stuff.
With the ability to check issues as solved, we can also calculate the estimated reduction for next weeks reports. This is mostly for my own benefit, if the estimate is low I can put in the hours to change that, If the estimate is high I can prioritize my time better.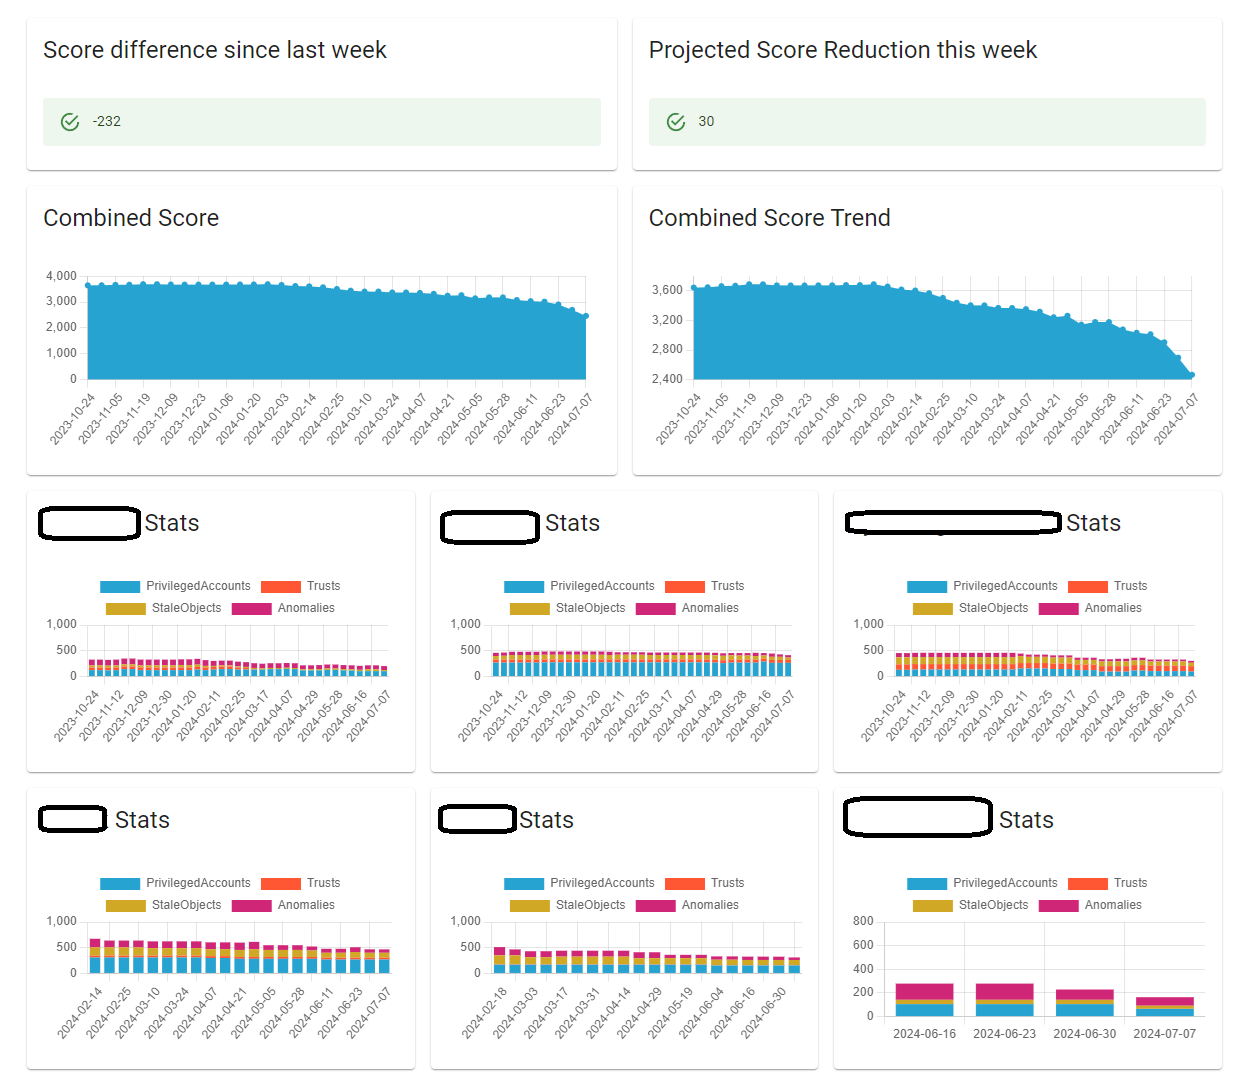
Clicking the “Projected” card, will show a list of RiskRules that has been fixed.
With the data from the reports located in a database we can also work smarter. and instead of opening one report from one domain to look at issues, we can look at one issue and see other affected domains.
Not all of our domains have the same priority, therefore the workflow of working one domain at a time can result in us forgetting the best way of fixing things once we get to the older ones - while notes can help. simply getting it fixed across the board is a lot better.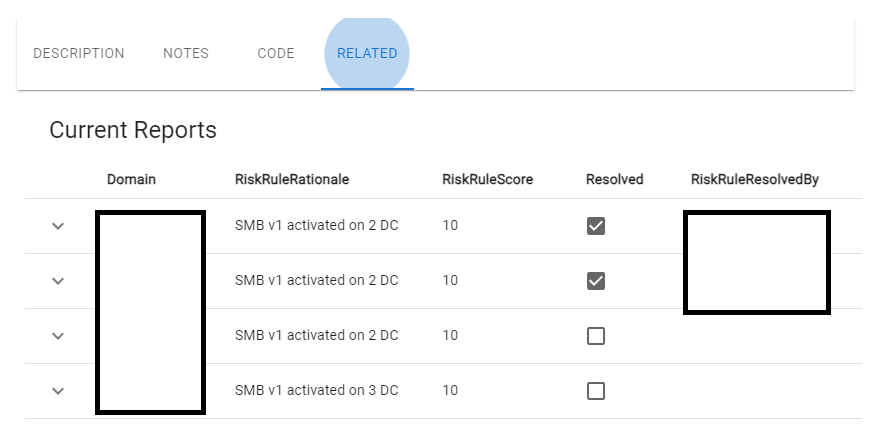
0f7bdfb9e29c9c090761d248ced7b34e4356996b.png
635898a0e81f0bdff41ea2c121cde0fb3245f54d.png
5ed849a2dee1de6b3ac5035737c044e82c64aabc.png