ChartJS line charts using datasets fail to draw lines between datapoints
ChartJS line charts using datasets fail to draw lines between datapoints
Product: PowerShell Universal
Version: 3.9.0
Hi folks,
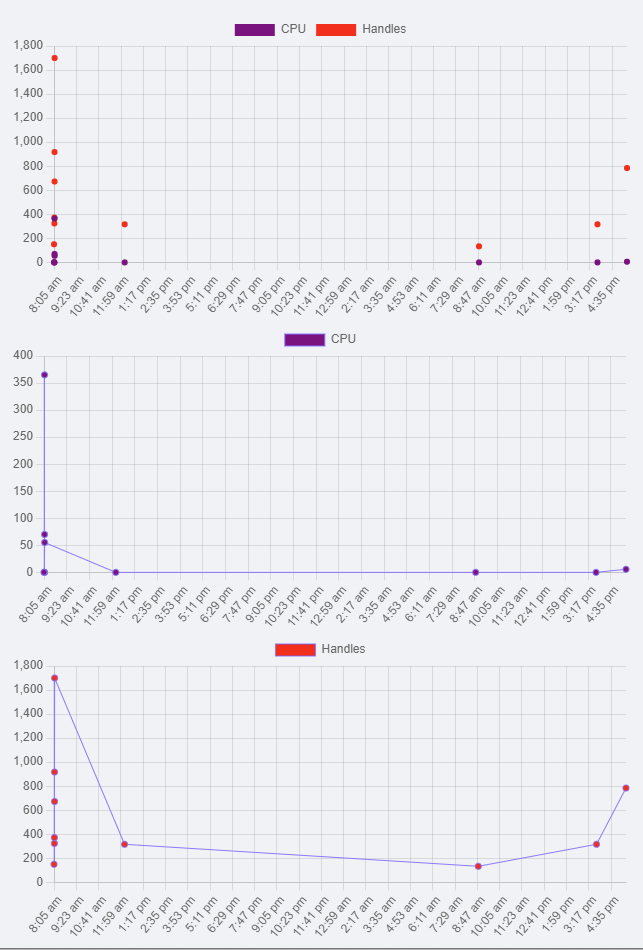
I’m having issues with ChartJS line charts while using datasets. Though the chart renders with datapoints from both datasets, it will not draw the lines between the datapoints. Here is some code and a screenshot to demonstrate the issue. As you can see, the same data works with a single dataset in a separate chart.
I’ve tried specifying various ChartJS options such as spanGaps and showLines but they did not work. Default ChartJS behaviour is to draw the lines, so I don’t think any further settings should be required.
Any ideas?
Thanks!
New-UDDashboard -Title "PU ChartJS Line chart test - Datasets don't show lines" -Content {

    # Simple data from Get-Process
    $Data = Get-Process | Select-Object -First 10 | Sort-Object -Property StartTime -Descending

    # Two datasets, one for CPU and one for Handles
    $CpuDataset = New-UDChartJSDataset -DataProperty CPU -Label "CPU" -BackgroundColor Purple -BorderColor Purple -XAxisId "x"
    $HandlesDataset = New-UDChartJSDataset -DataProperty Handles -Label "Handles" -BackgroundColor Red -BorderColor Red -XAxisId "x"

    $UDChartOptions = @{
        Type          = "line"
        Data          = $Data
        Dataset       = @($CpuDataset, $HandlesDataset)
        LabelProperty = "StartTime"
    }

    # ChartJS options to properly format the x-axis as time
    $ChartJsOptions = @{
        scales = @{
            x = @{
                type = "time"
                time = @{
                    unit = "minute"
                }
            }
        }
    }

    # Using datasets does not show the connector line between datapoints
    New-UDChartJS @UDChartOptions -Options $ChartJSOptions

    # Without using datasets, the connector lines show between datapoints
    New-UDChartJS  -Type "line" -Data $Data -DataProperty CPU -LabelProperty StartTime -BackgroundColor Purple -BorderColor Purple -Options $ChartJsOptions
    New-UDChartJS  -Type "line" -Data $Data -DataProperty Handles -LabelProperty StartTime -BackgroundColor Red -BorderColor Purple -Options $ChartJsOptions
}
cdde286477f07e7fd6e299f99a87b5c48bfe64aa.png
All Comments (1)
Same question, as I’m seeing this same behavior in version 4.2.21. @Adam Driscoll Do you have sample code for using datasets with line charts?