Monitoring DVLS service Externally
Hello.
We want to monitor the status of the DVLS application using an external monitoring tool, in this case with Zabbix.
Is there a way to check the status of the service inside the server?
Regards
Ricardo Neves
All Comments (10)
Hello,
Do you mean the Scheduler service or if the DVLS web application is running?
If it's the DVLS web application, then the Zabbix application can only verify if your DVLS URL sends a 200 HTTP code.
Best regards,
Érica Poirier
Hello,
Which version of Zabbix are you using? Which Zabbix agent is being used?
In Zabbix 7.0 with Zabbix Agent 2:
The standard Windows template is used to monitor all Windows services. So that the Devolutions Scheduler runs.
The template “IIS by Zabbix agent active” is used to monitor the IIS. In addition, “IIS management scripts and tools” must be installed on the Windows server.
In addition, the availability of the site can be monitored via the web scenarios.
New in Zabbix 7 is the possibility to monitor Item Browser.
Here are the links:
https://www.zabbix.com/de/integrations/iis
https://www.zabbix.com/documentation/7.0/en/manual/config/items/itemtypes/browser
https://www.initmax.com/wiki/installation-and-basic-usage-of-browser-item/
Good luck
Alex
Hello Alex,
Thank you for sharing this detailed information and the helpful resources.
We appreciate you highlighting the use of Zabbix 7.0 with Agent 2, along with the standard Windows monitoring template and the “IIS by Zabbix agent active” template. This is indeed a valid approach for monitoring the Devolutions Scheduler service and the IIS site hosting Devolutions Server.
Your mention of enabling IIS management scripts and tools is also spot on that step is required for proper IIS metric collection.
Additionally, using web scenarios to monitor the availability of the Devolutions Server web interface is a great way to ensure responsiveness and uptime, and we’ll also take note of the new Item Browser feature introduced in Zabbix 7.
Best regards,
Michel Audi
Hello Michel,
Do you have any recommendations on how to set up a monitoring template in Zabbix? Or do you have any other recommendations on how to monitor DVLS that is ok?
We have 4 production servers running DVLS and we need to monitor if the application is running fine.
Hello Alex,
Thank you for reaching out.
While creating monitoring templates in Zabbix falls outside the scope of what I can directly assist with, I can certainly offer some guidance on monitoring Devolutions Server (DVLS) in general.
To help ensure your four production DVLS servers remain healthy, here are a few key areas to monitor:
- DVLS Web Interface: Regularly verify the availability of the DVLS web UI by checking its URL.
- DVLS Services: Ensure the Devolutions Server Scheduler service and any related services such as the Gateway are running as expected.
- IIS Application Pool: Confirm that the IIS Application Pool used by DVLS is started and remains in a healthy state.
- SQL Server: As DVLS relies on SQL Server for its backend, it's important to monitor database connectivity and performance.
- Log Files: Regularly review DVLS logs, especially:
- C:\inetpub\wwwroot\<DVLS instance>\App_Data\DPS_Main.log
Regarding logging, DVLS supports several methods, including integration with a Syslog server, which may help centralize and streamline log monitoring alongside your existing tools.
Best regards,
Michel Audi
Hello Michel,
Hello Jakub,
I can recommend the following based on Michel's recommendations:
I am referring to the current Zabbix LTS version at the moment.
DVLS Services: Ensure the Devolutions Server Scheduler service and any related services such as the Gateway are running as expected.
All Devolutions Servers must be monitored individually. To do this, Zabbix Agent 2 must be installed on each server.
The Windows template must be stored in the Zabbix WebUI on each monitoring host. This is also used to monitor the Windows services out-of-the-box, as long as these startup types are “automatic”.
DVLS Web Interface: Regularly verify the availability of the DVLS web UI by checking its URL.
The “Web scenario” is suitable for monitoring the WebUI. A separate template must be created for this, which is adapted to your own environment. This monitors the page call. An alarm can be triggered for HTTP <> 200.
https://www.zabbix.com/documentation/7.0/en/manual/web_monitoring
IIS Application Pool: Confirm that the IIS Application Pool used by DVLS is started and remains in a healthy state.
The IIS template already integrated in Zabbix can be used for monitoring. Only an additional feature for the IIS needs to be installed on the Devolutions Server so that the IIS can be fully monitored.
https://www.zabbix.com/de/integrations/iis
SQL Server: As DVLS relies on SQL Server for its backend, it's important to monitor database connectivity and performance.
There are additional plugins for the Zabbix Agent 2 to monitor the SQL Server. These must be installed on the SQL Server. The SQL template is then stored on the SQL Server monitor host and adapted to the corresponding environment.
https://www.zabbix.com/integrations/mssql
Log Files: Regularly review DVLS logs, especially
Zabbix also has an integrated option for monitoring log files.
https://www.zabbix.com/documentation/7.0/en/manual/config/items/itemtypes/log_items
As the topic of this request is primarily related to Zabbix, I recommend the Zabbix forum. There is also very competent help here.
https://www.zabbix.com/forum/
I hope this helps.
Good luck
Alex
Hello Alex,
Thank you, for all your recommendations. We truly appreciate your prompt response this information could be valuable for helping other customers as well.
Best regards,
Michel Audi
Hello,
Do you mean the Scheduler service or if the DVLS web application is running?
If it's the DVLS web application, then the Zabbix application can only verify if your DVLS URL sends a 200 HTTP code.
Best regards,
@Erica Poirier
Hello,
Sorry, but I'm borrowing this thread. We still get a 200 HTTP code when the page looks like this. Is there any other URL we can use or can this be solved by you using another header?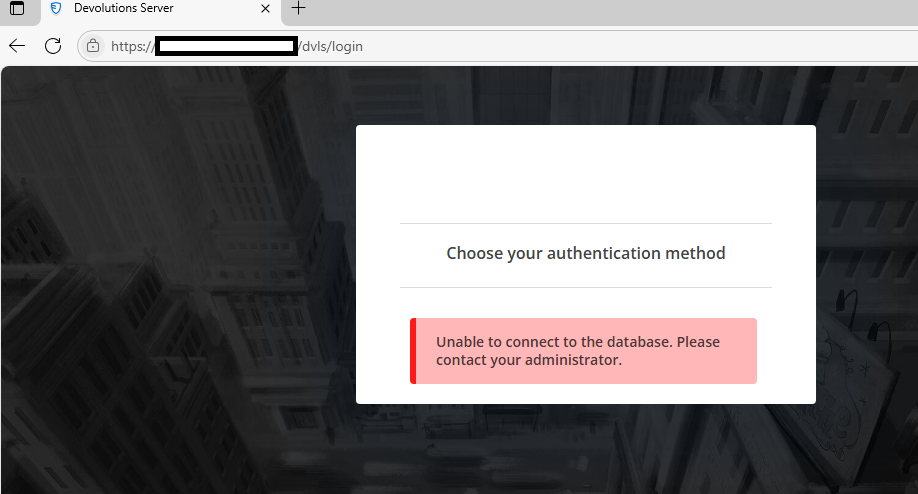
Regards,
Simon
96fcfbef-4430-4dc4-b725-1e0739245410.png
Hello Simon,
I'll answer your question.
You want to use Zabbix to monitor server availability via the “Web Scenario” monitoring feature.
From my own experience, I know that this is not so easy, especially if JavaScript is used on the server.
The fact that you can reach the server is a good sign. Otherwise, you would not get an HTTP 200 response.
If you then want to log in, you will most likely have to work with JavaScript within Zabbix if you are using multiple authentication methods.
However, since Zabbix 7.0, there is another way to monitor websites with Zabbix. - Monitor websites with browser items
https://www.zabbix.com/documentation/7.0/en/manual/guides/monitor_browser
I therefore recommend switching to this Zabbix monitoring. There are many tutorials on the internet that explain how to set this up.
Otherwise, ask in the Zabbix forum.
I hope this helps. Good luck!
Alex
@AlexMoucha
Hi,
We are looking for a way to monitor the basic health of DVLS, for example when the database is unavailable. Preferably without maintaining a synthetic user platform, that gives tons of metrics we don't really are interested in.
I see two simple ways, one would be if there's another URL that could throw an error when the app pool can't reach the database, and we could monitor that URL
Or if it's supported, within IIS, to have the page attached earlier, throw a custom non-200 response. Not sure if that is possible.
Regards,
Simon