RDM Gateway - Website not working
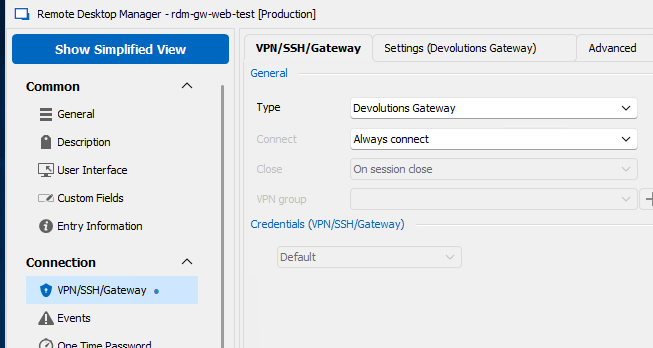
We are trying to get websites working over RDM gateway, but unsuccesful
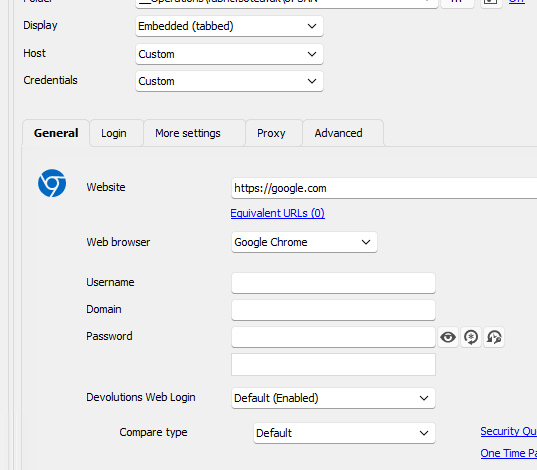
Tried try create a google test connections, but same error
What are we doing wrong?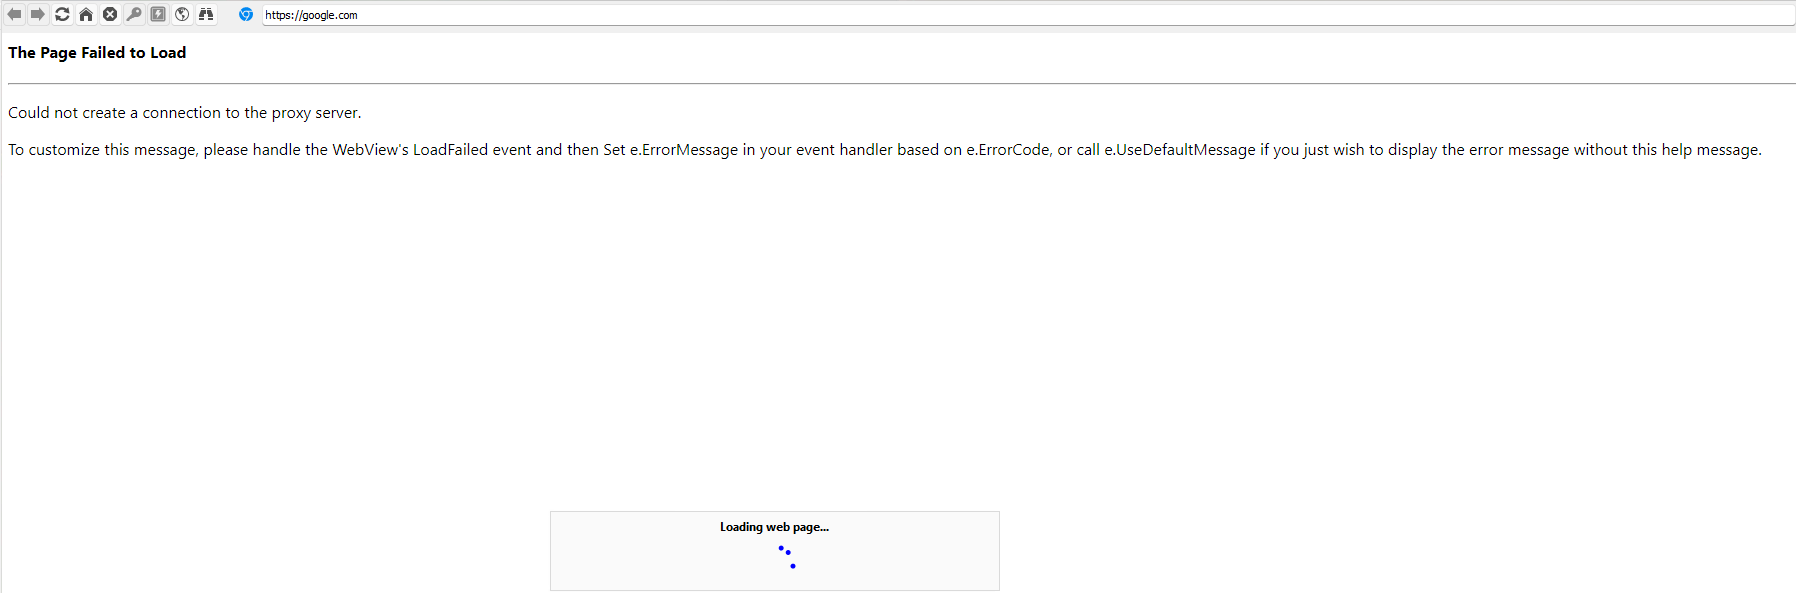
484d7d32-905b-49d9-b017-f8e9303b707c.png
3627c9c9-53ee-4ded-8b4c-025e17360ccb.png
dd99df52-73d3-45b6-b456-510e3390896a.png
All Comments (8)
Hello,
Could you please go to Administration > Devolutions Gateway > ... > Logs and provide us with the logs whenn you try to open the connection? It should look something like this:
2023-07-06T19:51:35.963695Z  INFO scheduler: jmux_proxy: (l#0 d#0) request tcp://google.com:443
2023-07-06T19:51:36.165091Z  INFO scheduler: jmux_proxy: (l#1 d#1) request tcp://www.google.com:443
2023-07-06T19:52:10.746988Z  INFO listener{url=http://[::]:7171/}:http{client=[fe80::d863:baa4:165d:96c6%6]:54738}:request{method=GET path=/jet/sessions}: devolutions_gateway::middleware::log: duration=340µs status=200 OK
2023-07-06T19:52:16.510469Z  INFO listener{url=http://[::]:7171/}:http{client=[fe80::d863:baa4:165d:96c6%6]:54740}:request{method=GET path=/jet/diagnostics/logs}: devolutions_gateway::middleware::log: duration=3.4257ms status=200 OK
Also, if you go on the server hosting Devolutions Gateway, can you reach google.com?
Can you also confirm what version of RDM, Devolutions Server, and Devolutions Gateway you are using?
Best regards,
Richard Boisvert
27ef3441-d2d0-4174-93e1-e549536db4d2.png
2023-07-07T05:30:24.712737Z  INFO listener{url=https://0.0.0.0:7171/}:https{client=172.16.4.65:57869}:request{method=GET path=/jet/jrl/info}: devolutions_gateway::middleware::log: duration=328.9µs status=200 OK
2023-07-07T06:00:57.755829Z  INFO devolutions_gateway: Received control code: SessionRemoteConnect(2)
2023-07-07T06:00:58.282190Z  INFO devolutions_gateway: Received control code: SessionUnlock(2)
2023-07-07T06:01:36.800382Z  INFO listener{url=https://0.0.0.0:7171/}:https{client=172.16.4.65:57965}:request{method=GET path=/jet/diagnostics/logs}: devolutions_gateway::middleware::log: duration=8.3599ms status=200 OK
172.16.4.65 is the Devolutions server
As you can see, my logs does not quite look like yours
Also, if you go on the server hosting Devolutions Gateway, can you reach google.com?
Yes
RDM version: 2023.1.29.0
Devolutions Server: 2023.1.8.0
Devolutions Gateway: 2023.2.2
Hello,
I am not able to reproduce, can you provide more logs. Also do you have any log in the Datasource logs?
(Edited, my gateway was down, sorry for the inconvenience )
Best regards,
Marc-Andre Bouchard
Hello,
is your Devolutions Gateway installed side by side or is it a standalone installation ?
Do you have a license for your Devolutions Gateway or are you using the free installation with the 5 concurrent sessions ?
Thanks for your feedback,
Best regards,
Vincent Forest
Best regards,
Vincent Forest
Hello,
is your Devolutions Gateway installed side by side or is it a standalone installation ?
Do you have a license for your Devolutions Gateway or are you using the free installation with the 5 concurrent sessions ?
Thanks for your feedback,
Best regards,
Vincent Forest
Standalone. It is for a closed subnet internally
Yes we got license
Hello,
It seems Devolutions Gateway logs you sent us are not showing anything meaningful, so I suspect the problem is happening somewhere before reaching the Gateway itself. Do you think you could send us some additional logs?
Here is how you can generate a report that you can send us.
First, increase the debug level from "0" to "1" in File – Options – Advanced.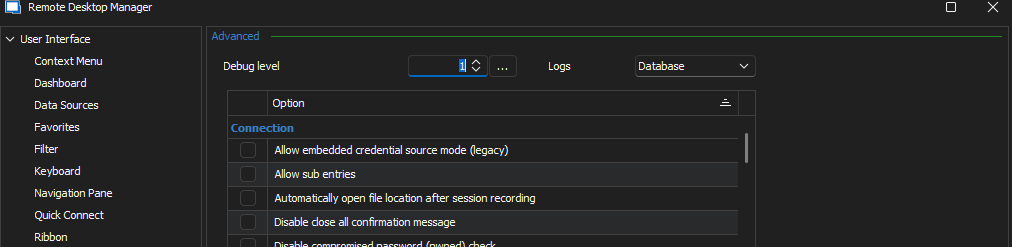
Then, reboot RDM so the change takes effect and proceed to reproduce the issue.
Once the issue has been reproduced, navigate to Help – Application Logs – Report, and click on the Send to Support button to securely send the trace to our support team. Put a link to this thread in the message field so the trace can be linked to this case more easily.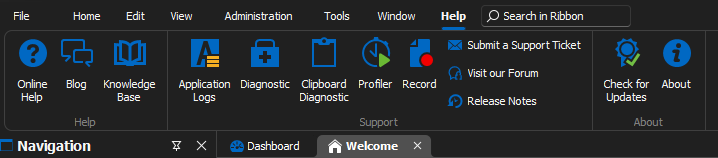
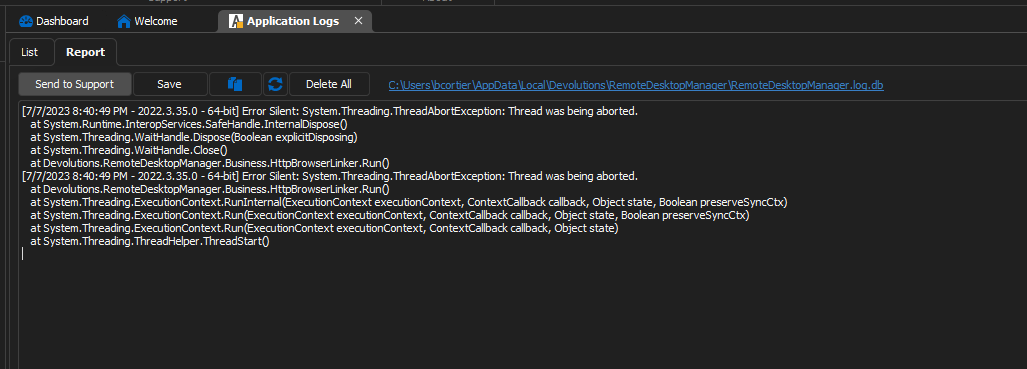
(You can read more on that in our documentation at https://docs.devolutions.net/rdm/windows/commands/help/support/application-logs/)
I also need to see the logs you have in the folder at %AppData%\jetsocat on your machine where RDM was run.
("jetsocat" is an open source tool developed by us and used internally by RDM when connecting to websites via Devolutions Gateway: https://github.com/Devolutions/devolutions-gateway/tree/master/jetsocat)
You can safely zip the "jetsocat" folder and attach it here as nothing sensitive is logged in these, or alternatively you may send the zip file to our support team at service@devolutions.net and mention this thread, at your preference.
Best regards,
Benoit Cortier
f4d532b9-0457-458e-94b7-ddb97378655d.png
95a5280d-d4ab-41dd-a242-ad5721c0e3be.png
6d42e259-c979-4baf-ae86-9a88176e3569.png
0aabc9b1-6ea1-4f8e-b041-a550356f64d0.png
Hello,
It seems Devolutions Gateway logs you sent us are not showing anything meaningful, so I suspect the problem is happening somewhere before reaching the Gateway itself. Do you think you could send us some additional logs?
Here is how you can generate a report that you can send us.
First, increase the debug level from "0" to "1" in File – Options – Advanced.
Then, reboot RDM so the change takes effect and proceed to reproduce the issue.
Once the issue has been reproduced, navigate to Help – Application Logs – Report, and click on the Send to Support button to securely send the trace to our support team. Put a link to this thread in the message field so the trace can be linked to this case more easily.
(You can read more on that in our documentation at https://docs.devolutions.net/rdm/windows/commands/help/support/application-logs/)
I also need to see the logs you have in the folder at %AppData%\jetsocat on your machine where RDM was run.
("jetsocat" is an open source tool developed by us and used internally by RDM when connecting to websites via Devolutions Gateway: https://github.com/Devolutions/devolutions-gateway/tree/master/jetsocat)
You can safely zip the "jetsocat" folder and attach it here as nothing sensitive is logged in these, or alternatively you may send the zip file to our support team at service@devolutions.net and mention this thread, at your preference.
Best regards,
Thanks for you reply. Both are sent now
Thank you very much!
Looking at the logs from jetsocat, it looks like an issue related to TLS (SSL).
Here is an excerpt containing no private information from the file "jmux-proxy_1688800773.log" you sent to us:
ERROR jetsocat: Couldn't open pipe: WebSocket connect failed: WebSocket handshake failed: TLS error: native-tls error: A certificate chain processed, but terminated in a root certificate which is not trusted by the trust provider. (os error -2146762487)
This error means the root certificate returned by the target server is not recognized as a trusted root certificate.
The target server here is either a reverse proxy, such as nginx or IIS, that is ultimately redirecting to Devolutions Gateway service or the Devolutions Gateway service itself depending on how your infrastructure is configured.
I understand you are using a private TLS certificate chain, using your own root certificate. Is that correct?
In that case, it’s likely that you need to add this root certificate to the Windows certificate store of the machine running RDM.
For that, you can download the root certificate on the machine and "open" it. Normally, this will open the certificate window. Make sure this is the correct certificate, then choose "Install Certificate…" which will make the "Certificate Import" wizard appear. At some point, you’ll be prompted for the certificate store. Choose "Place all certificates in the following store" and select the "Trusted Root Certification Authorities" store. Complete the remaining steps until you click "Finish".
Note that this certificate can be distributed automatically using a Windows Group Policy: https://learn.microsoft.com/en-us/windows-server/identity/ad-fs/deployment/distribute-certificates-to-client-computers-by-using-group-policy
At this point, you can try to open the website entry again and check that everything is working as expected.
If everything is working as expected, don’t forget to set back the Application Log level to "0" in RDM settings.
Benoit Cortier