Workflow Map Dashboard
Product: PowerShell Universal
Version: 2026.1.5
Hi everyone,
I am looking for a way to create a Workflow Mapor a visual connection overview within PowerShell Universal.
My goal is to visualize the dependencies of a specific process, starting from an API Endpointthat triggers one or more Scripts, which then call further Sub-Scripts, including any linked Schedules.
Basically, I want to improve the traceability of complex processes so it’s easier to see “what triggers what” at a glance.
Does a built-in feature for this exist, or has anyone in the community built a custom Dashboard or used the PSU API to generate such a dependency map? I would love to hear how you handle process documentation and flow visualization within PSU.
Thanks in advance for your insights!
Recommended Answer
This module works well for visualizing EventHub connections.
github.com
All Comments (7)
This module works well for visualizing EventHub connections.
github.com
Hi @AnonymousUser ,
thanks for the advice. I was able to use it to create a static diagram for now. I’m now considering the best way to call the endpoints and establish a connection. Are there any best practices for this?
After hours of work, I was able to achieve a great result
Nice! I’d love to see it when it’s done. I’ll need to make something similar soon.
Here is the final result. The goal was to make the flowchart as dynamic as possible. The .url and .description properties of endpoints and scripts are used. In each endpoint, it is checked whether there are scripts with the .ps1 extension in the content. These are then retrieved using get-psuscript, and this is how the entire workflow is built: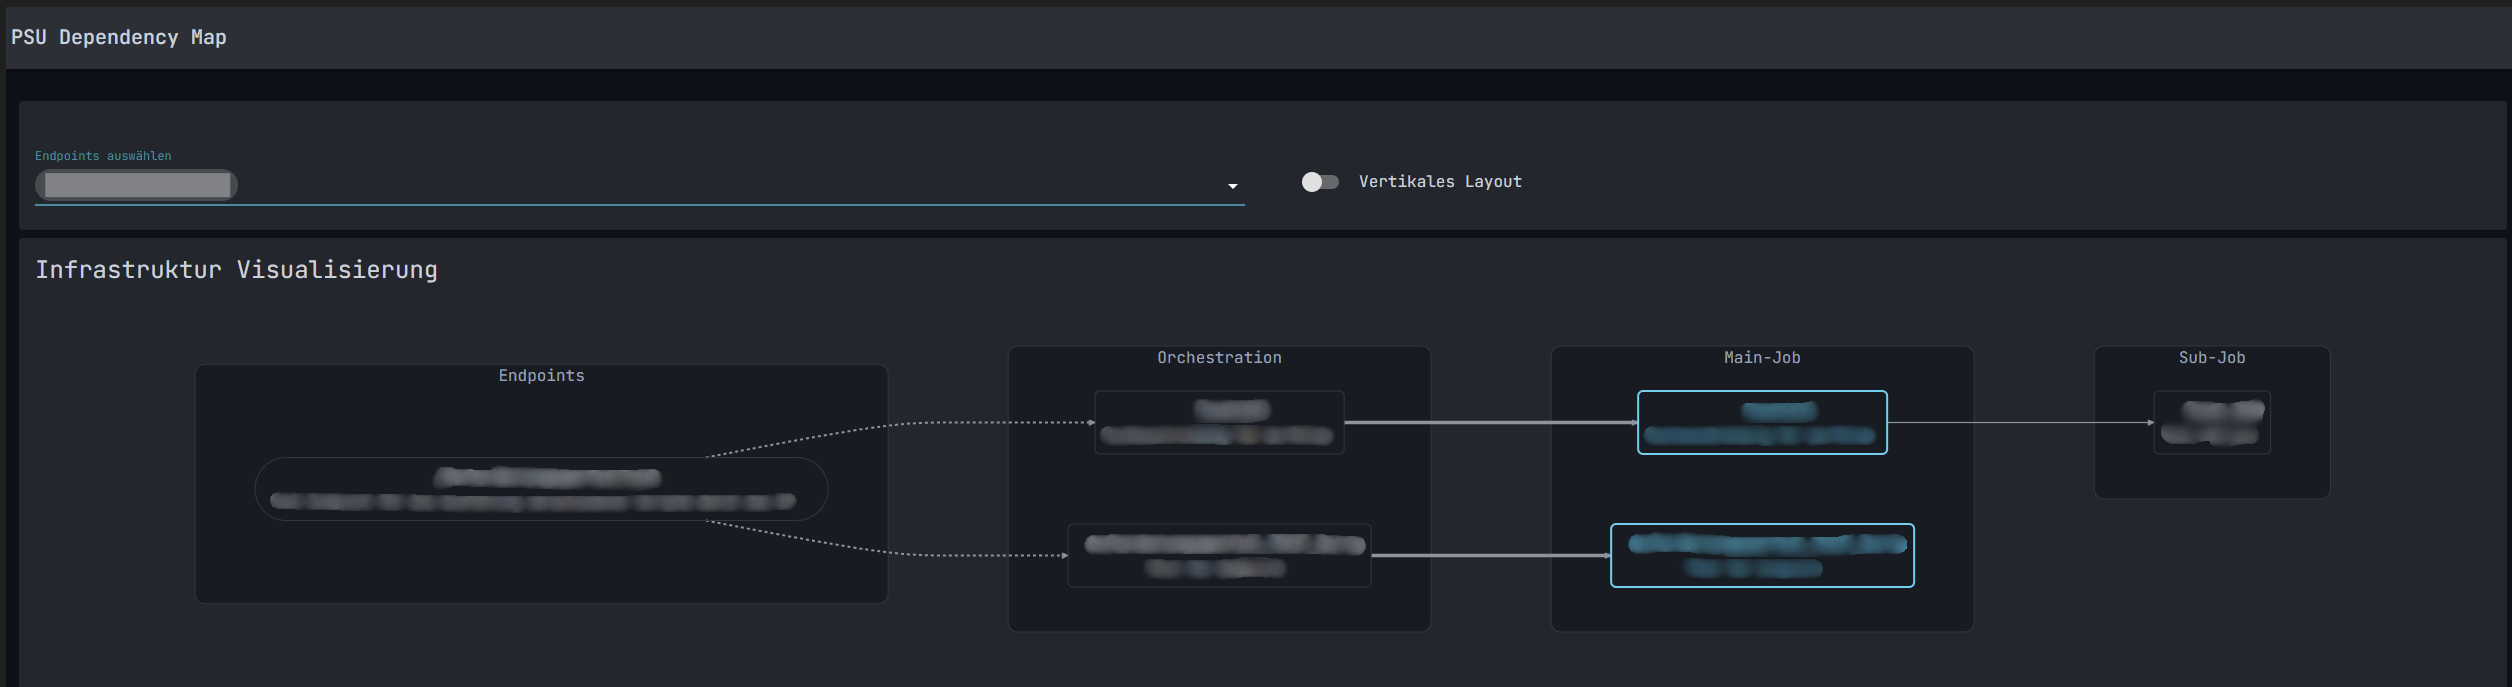
19dcc61421bc2c3de651b187a3c175449540e9c2.png
Wow, very nice!