PSU Cluster With Imbalanced Performance
Product: PowerShell Universal
Version: 5.6.4 & 5.6.8
We have a cluster composed of two nodes. Each node is on an identical VM, except that one is running 5.6.4 and the second is running 5.6.8.
I’ve noticed that node 1, which runs 5.6.4 is hovering at around 800 MB of memory while node 2, running 5.6.8 is around 3 GB
Is this a possible bug in version 5.6.8? Should I upgrade to 5.6.8?
Thanks!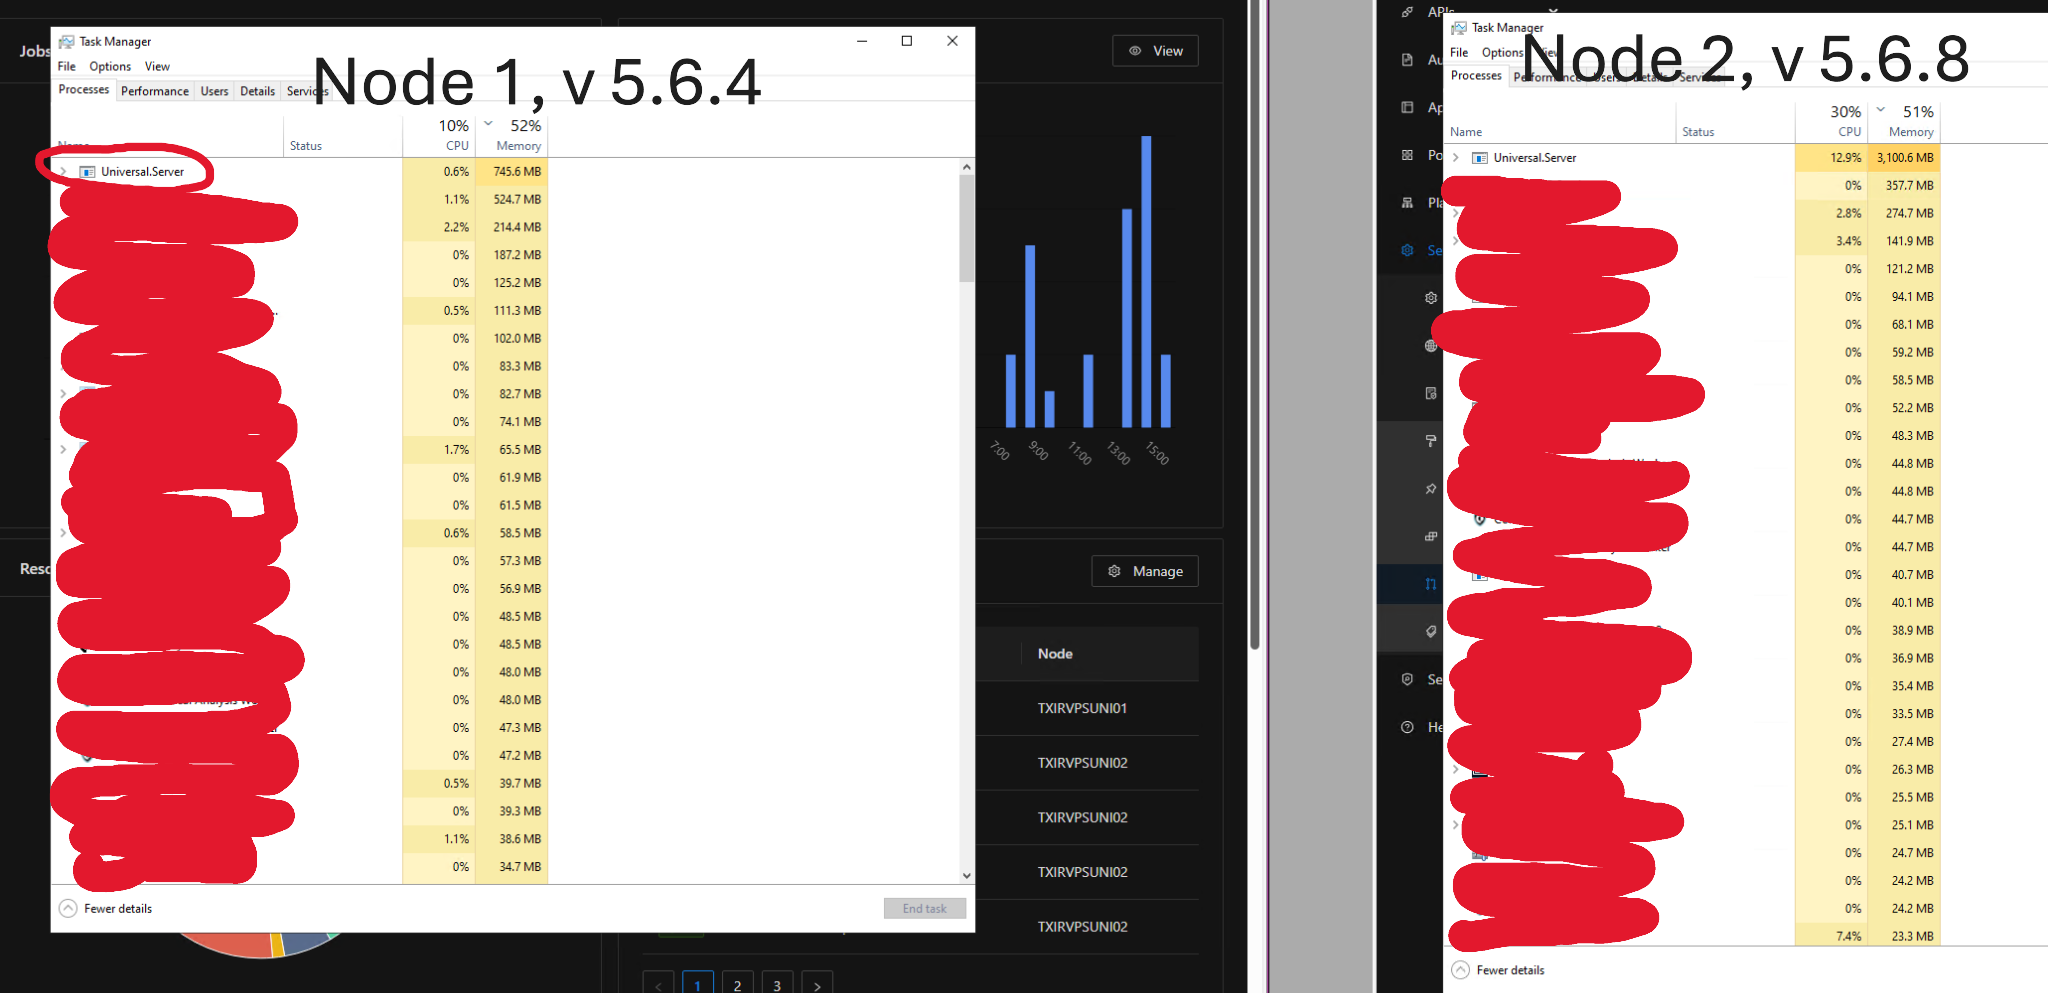
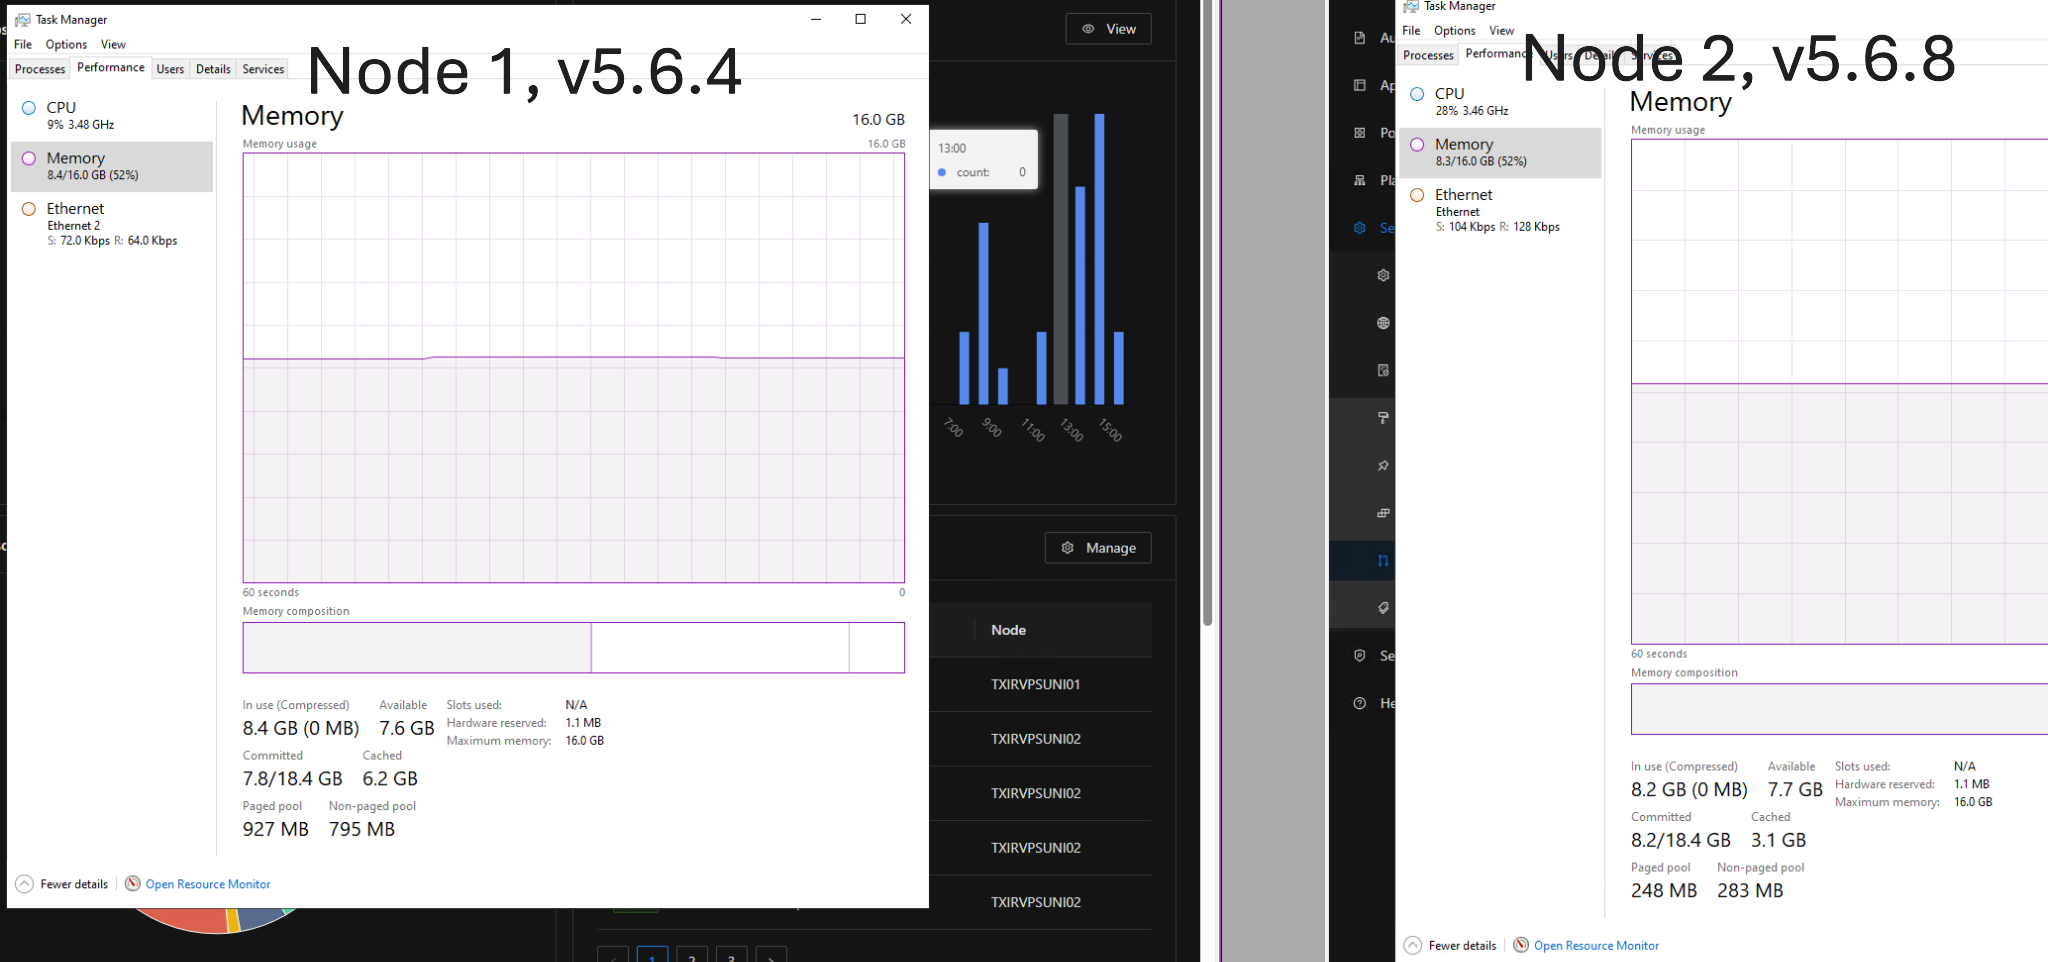
678336bc6103b55325feb998c3ce813c5fb7faa6.png
e372ec3d58903317bc84eab64d7c66ae080be761.png
All Comments (6)
How are your nodes running?
Some people have HA setup where both are used in the same sort of way,
I have mine as a web node and a job node.
At the time you checked this did you have any activity for running scripts that could have been hitting one node over the other?
Or any web activity to your apps that would be hitting one node over the other?
Well, their appsettings.json file is configured exactly the same way.
I do have some apps, but none are currently working in production anyway, so I stopped them all in case that had anything to do with it.
I believe I set them up to be used in the same way. I only put them behind a load balancer to have API calls to endpoints be more evenly distributed, which they appear to be doing in the logs.
I also see that scheduled scripts are being split between the nodes fairly evenly, so I don’t see anything unusual there either.
What version are you running? My first inclination was that perhaps 5.6.8 has a memory leak in it
I’m on 5.6.8. I have monitoring and historical logs on cpu, memory etc. I only updated on the 29th, just checked, node A looks to have remained consistent in memory usage and has no change. NodeB looks to have increased somewhat from an average around 53% memory usage to between 65 - 75%.Pagefile usage also increased and has been consistent since my update.
It’s not impacting me in any way currently, and there’s still plenty of free memory available on the box but it is curious that it’s consistently higher on one node since the update.
I didn’t check the paging file at first, but I see it there too. I have plenty of memory as well. It’s not really impacting performance, and it seems to stabilize, even if at a higher level than node 1.
I just wanted to document that this is happening on this version, if it is in fact some sort of bug.
Sure enough, after updating node 1 from 5.6.4 to 5.6.8, the memory usage spiked dramatically. (Please see below screenshot)
I also have noticed that, prior to updating, only node 2 was failing the groom job health check. Now, after updating, node 1 is failing the groom job health check as well
5fd4f0963f32883d3eb3ac0f097601a55a552b56.png
Can’t say I’ve had any groom job failures.