Prometheus metrics
Hi,
I’m trying to install metrics using this guide but I have no success
blog.ironmansoftware.com
My appsettings.json looks like this:
“Plugins”: [
“UniversalAutomation.LiteDBv5”,
“PowerShellUniversal.Plugin.OpenTelemetry”
],
“OpenTelemetry”: {
“Otlp”: {
“Endpoint”: “http://localhost:9090/api/v1/otlp/v1/metrics”
}
},
I also added $Env:OpenTelemetry__Otlp__Endpoint = ‘http://localhost:9090/api/v1/otlp/v1/metrics’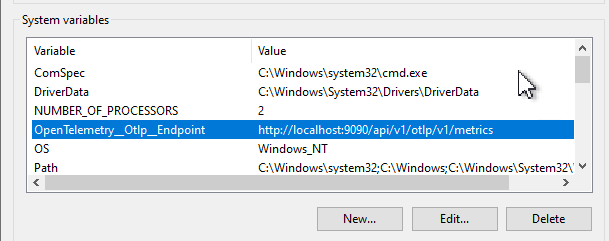
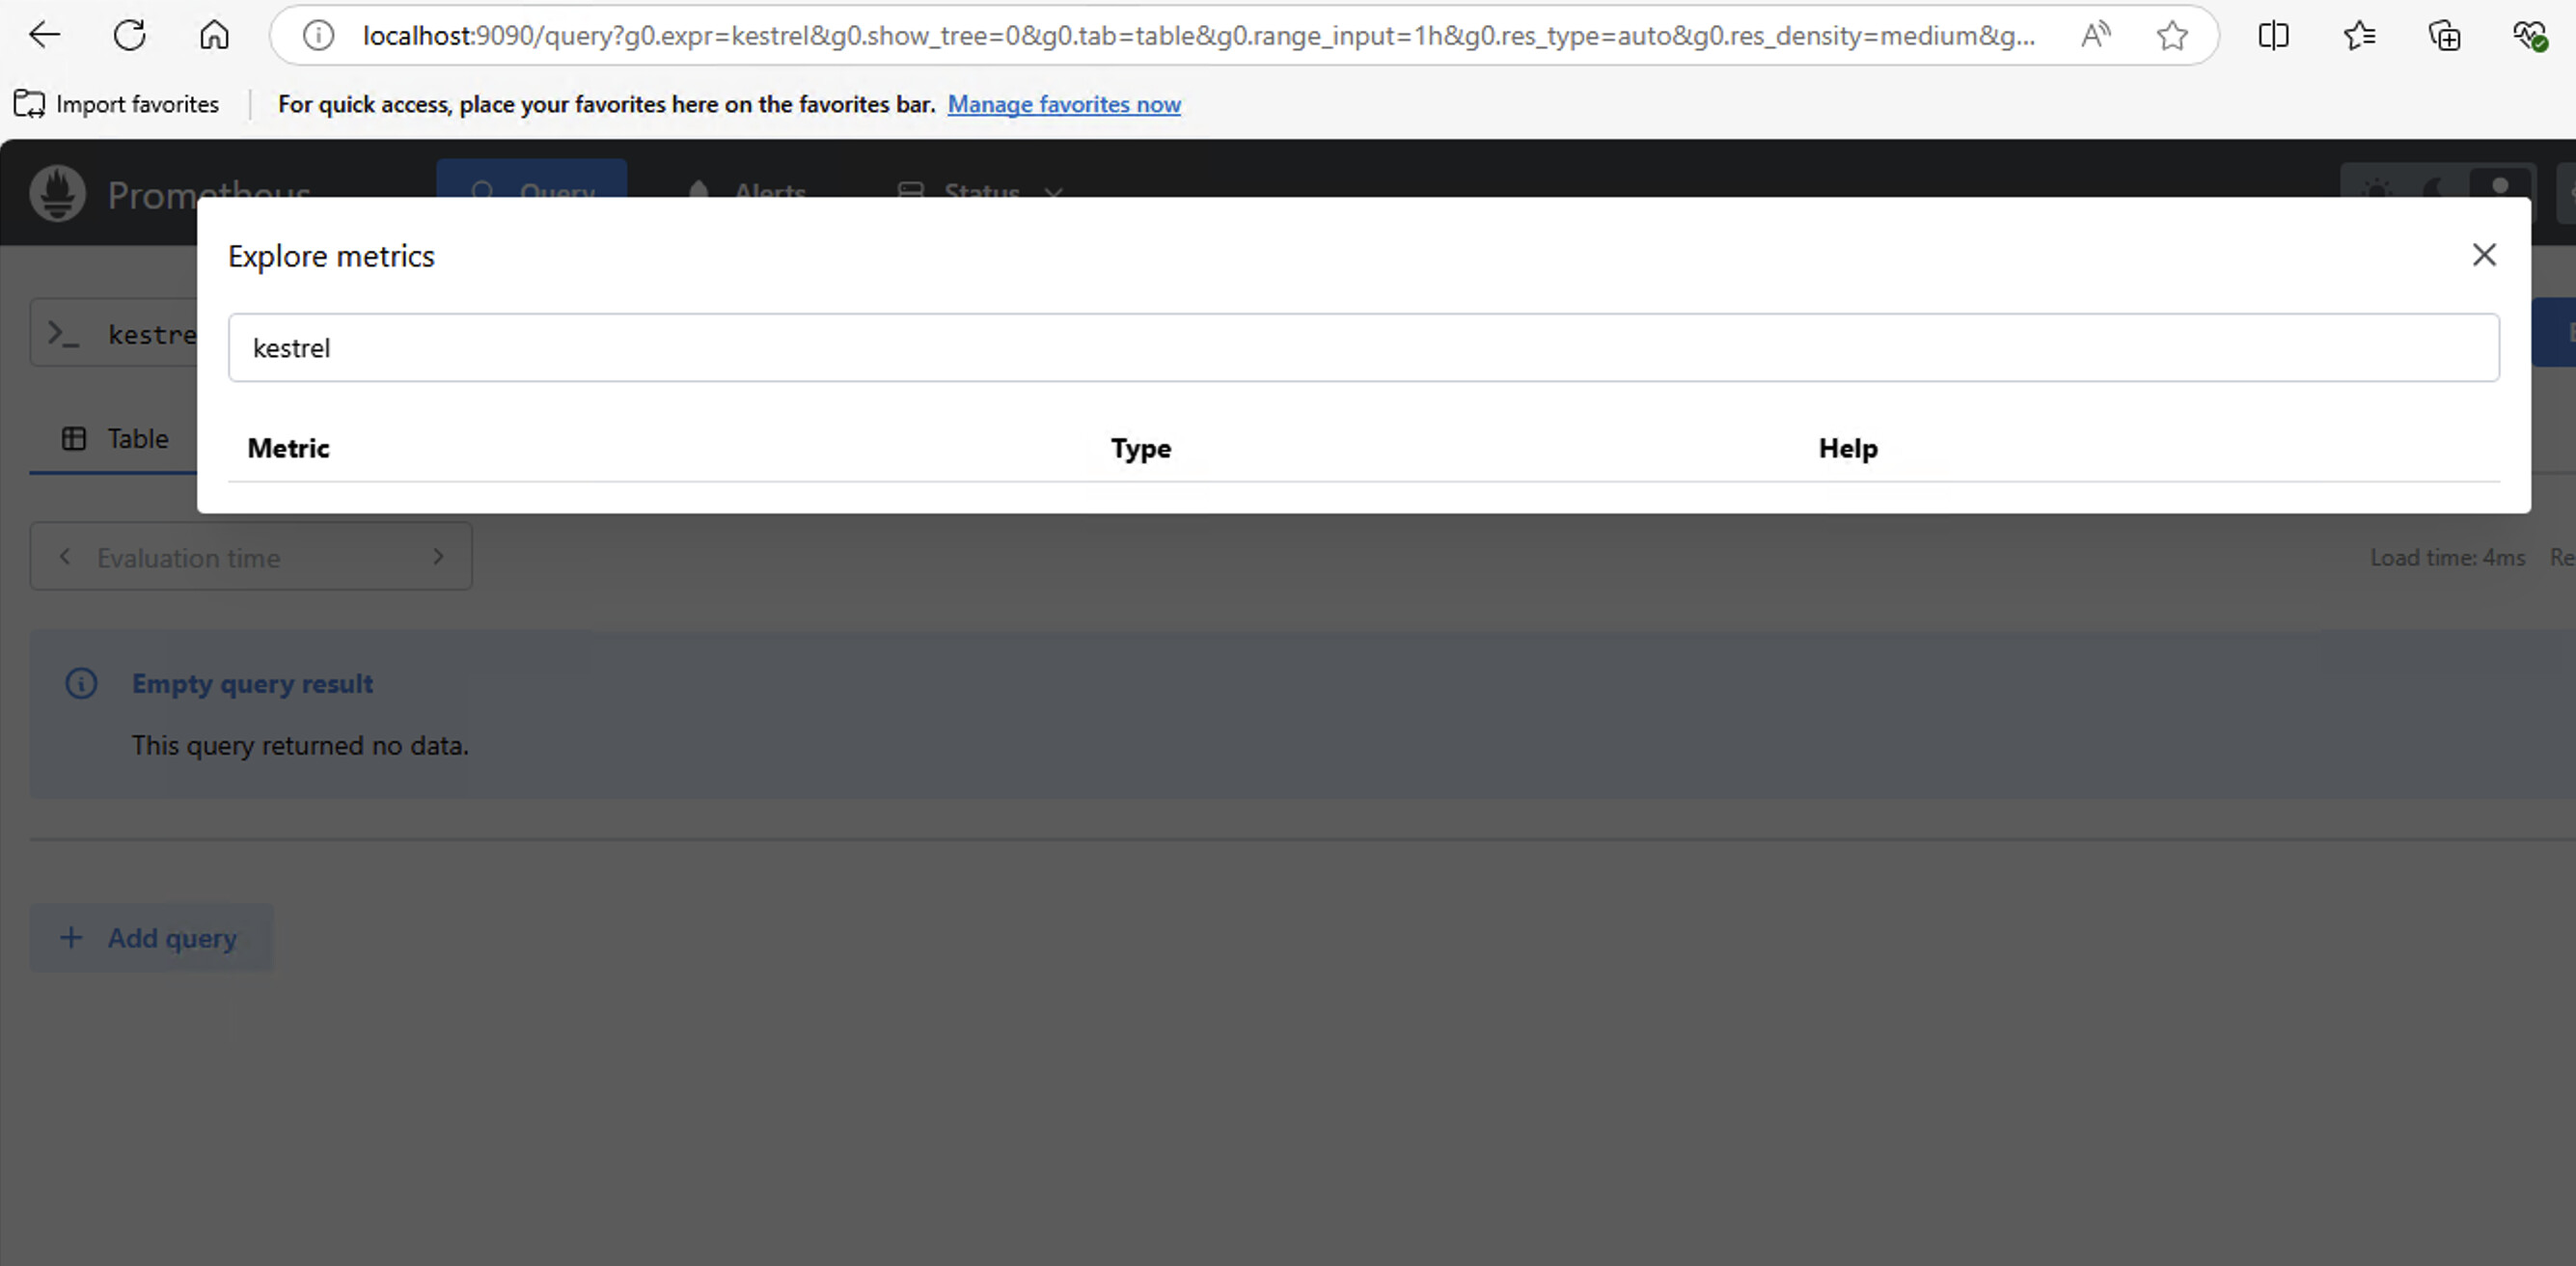
When I go to http://localhost:9090/api/v1/otlp/v1/metrics I have nothing and if I run prometheus and go to the same page I have this result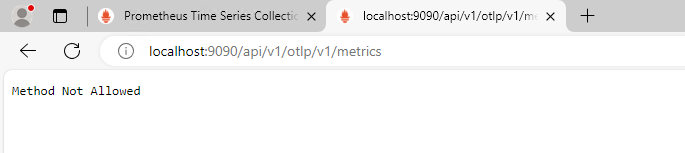
Query for http_server_duration_milliseconds_count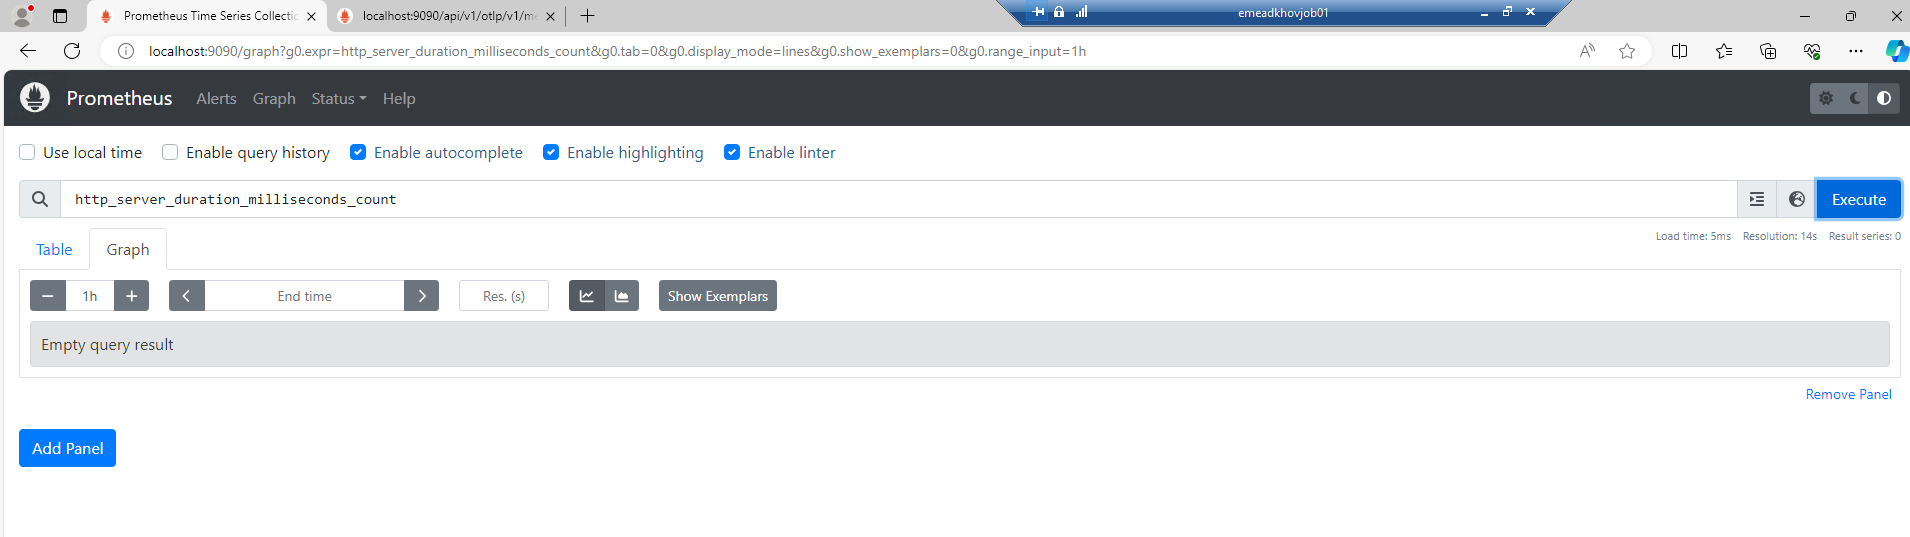
I have nightly build 4.2.15 (8475317850)
Am I missing something?
Thank you
f5f41dd5b1792ce859fe0e338fe0da48051eea8e.png
1b7f4af64100ff3fa5b50ae35796a627335cc312.png
5f8c1a582e4d30111ca711535a1d09b1034d7a04.png
All Comments (11)
Did you ever figure this out?
Curious if you’ve figured this out as well. I’m looking at implementing and exposing some custom app/dashboard level metrics. Would be nice if there was some more documentation around this.
Digging into this a little bit more - we’re running PSU v4.4.1 and I noticed that it doesn’t ship with the PowerShellUniversal.Plugin.OpenTelemetry module.
Can anyone from ironmansoftware comment or update on whether the otel libraries were added into any of the stable build at some point?
an anyone from ironmansoftware comment or update on whether the otel libraries were added into any of the stable build at some point?
I did not.
Can anyone from ironmansoftware comment or update on whether the otel libraries were added into any of the stable build at some point?
Scratch this, not necessary. I found the plugin libraries under C:\program files (x86)\universal\plugins
So there’s potentially a misunderstanding on my part. I’ve enabled the open telemetry plugin & added the otlp endpoint in my appsettings.json:
...
  "Plugins": [
    "SQL",
    "PowerShellUniversal.Plugin.OpenTelemetry"
  ],
  "OpenTelemetry": {
    "Otlp": {
        "Endpoint": "http://localhost:9090/api/v1/otlp/v1/metrics"
    }
  },
I guess I’m expecting to see raw metrics at http://localhost:9090/api/v1/otlp/v1/metrics like I would when running a prometheus exporter and hitting /metrics, but I just get localhost refused to connect.
I tried this in v4 and I gave up… I haven’t tested in v5 yet but now that i’m seeing this i’m reminded I need to try again.
Honestly, I haven’t tried this myself since I wrote that blog post. Feel free to open a GitHub issue for it. It should work on v4 and v5.
Adam Driscoll
PowerShell Expert and Developer at Devolutions
It looks like this was a Prometheus\PSU config issue on my end. I downloaded the latest version and had to use the following command line to start the OTLP connector.
.\prometheus.exe --web.enable-otlp-receiver
I also had to update the URL used by PSU.
"OpenTelemetry__Otlp__Endpoint": "http://localhost:9090/metrics"
Once that was done, I am now receiving metrics in Prometheus from PSU.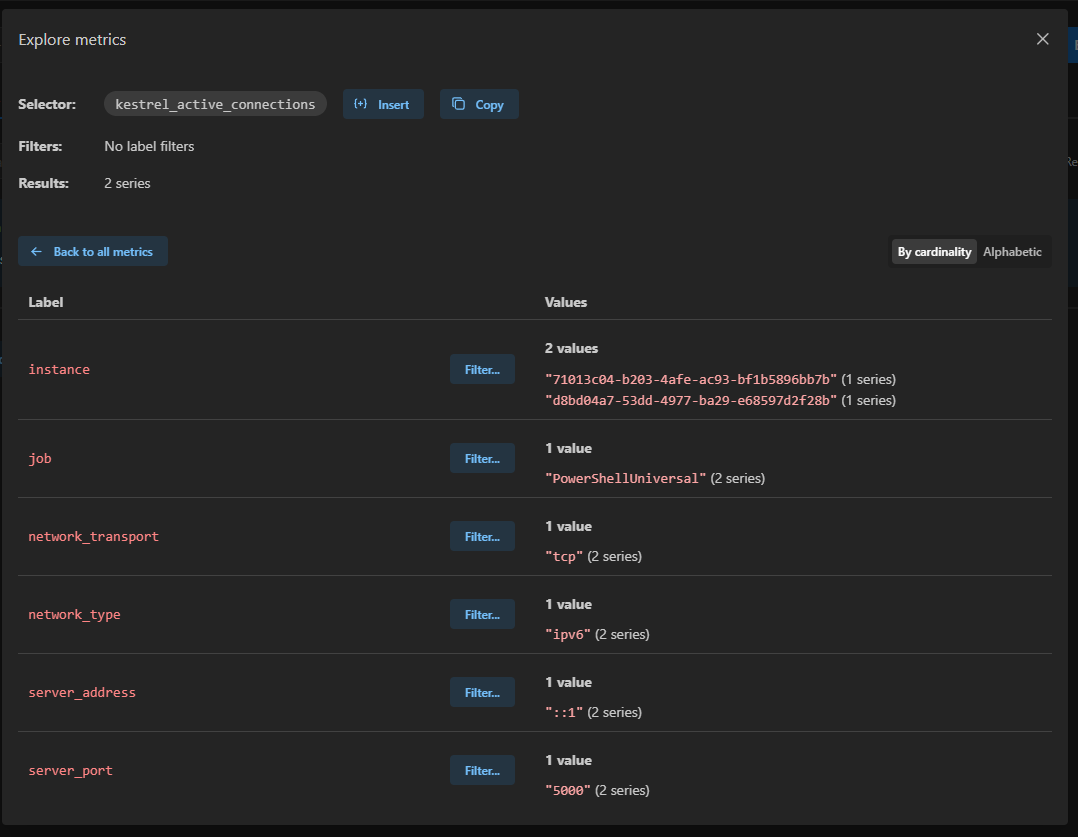
Adam Driscoll
PowerShell Expert and Developer at Devolutions
787e1b7af5a2bbc3bd128114da35f3bce5f155f4.png
Thanks for the test & update here Adam.
I just tried to get this running in our environment running PSU 4.4.1 with no luck. I’m not able to see any psu/platform related metrics in prometheus.
Running prometheus-3.1.0.windows-amd64
.\prometheus.exe --web.enable-otlp-receiver
in appsettings.json:
  "OpenTelemetry": {
    "Otlp": {
        "Endpoint": "http://localhost:9090/metrics"
    }
  },
EDIT: opened an issue on github: OTEL metrics not found in prometheus · Issue #4427 · ironmansoftware/powershell-universal · GitHub
2224511f99904f8eb1143366b6468db5ffabd109.jpeg
Dang I was hoping this was working.