Charjs Line chart - beginatZero?
What is everyones preferred method of getting a line chart to begin at zero?
The examples found in older posts on the forums does not work anymore.
$Options = @{
  Type          = 'line'
  Data          = $PingReportCombinedScoreList
  Dataset       = $DataSet
  LabelProperty = "Date"
  Options       = @{
      scales = @{
          yAxes = @(
              @{
                  ticks   = @{
                      beginAtZero = $true
                  }
              }
          )
      }
  }
}

New-UDChartJS @OptionsRecommended Answer
updating didn’t fix.
Not a single example on the forums worked, I suspect that the ChartJS library was updated to a version where the options formatting was changed.
iin the end, this worked:
$Options = @{
    Type          = 'line'
    Data          = $PingReportCombinedScoreList
    Dataset       = $DataSet
    LabelProperty = "Date"
    Options       = @{
        scales = @{
            yAxes =
            @{
                display     = $true
                beginAtZero = $true
            }
        }
    }
}

New-UDChartJS @OptionsAll Comments (2)
might wanna patch!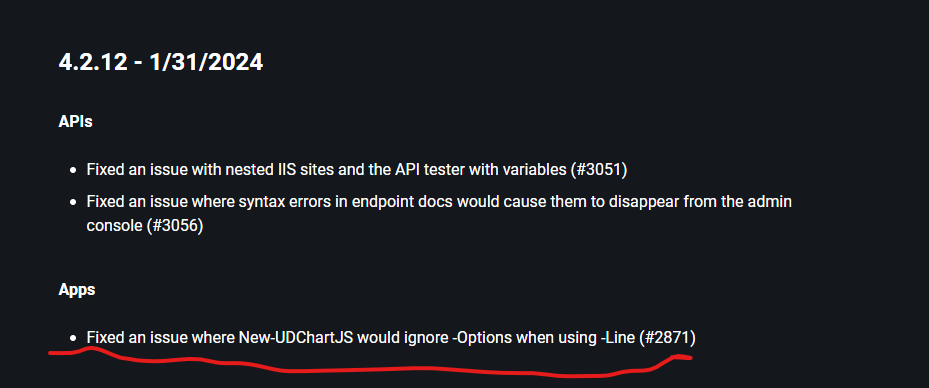
2a6c2341d8e668850de98a33b2016da1bf5e108c.png
updating didn’t fix.
Not a single example on the forums worked, I suspect that the ChartJS library was updated to a version where the options formatting was changed.
iin the end, this worked:
$Options = @{
    Type          = 'line'
    Data          = $PingReportCombinedScoreList
    Dataset       = $DataSet
    LabelProperty = "Date"
    Options       = @{
        scales = @{
            yAxes =
            @{
                display     = $true
                beginAtZero = $true
            }
        }
    }
}

New-UDChartJS @Options