New-UDChartJS not Rendering Line Chart as per Docs
Product: PowerShell Universal
Version: 4.0.1
Line chart rendered in docs has fill and smoothed lines (I believe this is “bezierCurve” in ChartJS speak). Actual line chart has neither of these features.
We are testing an upgrade from 2.12.6 where the line charts are rendering as expected.
Example Code
 $Data = Get-Process | Sort-Object -Property CPU -Descending | Select-Object -First 10
 New-UDChartJS -Type 'line' -Data $Data -DataProperty CPU -LabelProperty ProcessName
Expected Output as per Documentation (top) versus Actual Rendering (bottom)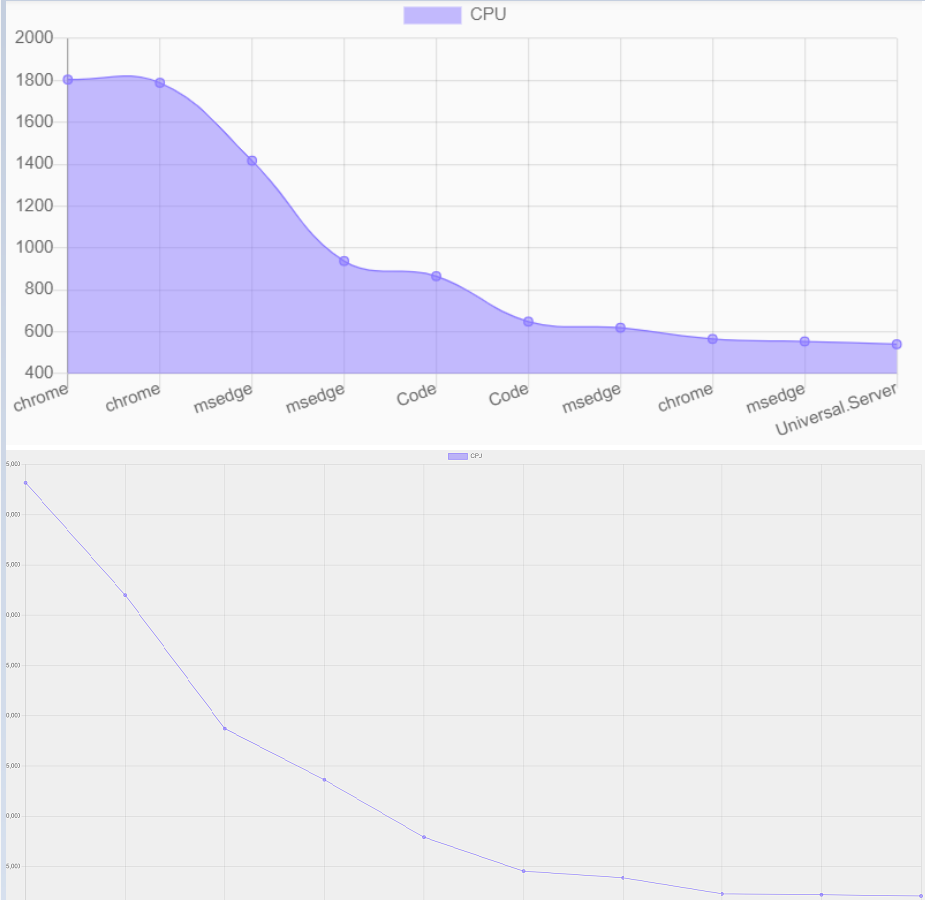
I’ve had to combine these into one image since new users are only allowed a single embedded image
6884c07789bca38d97ccdfb4e164b06063c17d1c.png
Recommended Answer
I can reproduce this. You can work around it by using a dataset and passing in the additional parameters.
$Options = @{
   fill = $true
   tension = 0.4
}
New-UDChartJSDataSet -AdditionalOptions $Options # ...
That said, we’ll make this the default in 4.0.2
Adam Driscoll
PowerShell Expert and Developer at Devolutions
All Comments (6)
+1 for this - I’m seeing this exact same behaviour
I can reproduce this. You can work around it by using a dataset and passing in the additional parameters.
$Options = @{
   fill = $true
   tension = 0.4
}
New-UDChartJSDataSet -AdditionalOptions $Options # ...
That said, we’ll make this the default in 4.0.2
Adam Driscoll
PowerShell Expert and Developer at Devolutions
Thanks Adam, that works. Looks like 4.0.2 is imminent, so we’ll hang fire for that
Hi Adam, we have upgraded to 4.0.2 and we are still seeing some odd behaviour on our line charts. When using datasets, the chart will plot the dots only, they won’t be joined by lines.
$Data = Get-Process | Sort-Object -Property CPU -Descending | Select-Object -First 10

New-UDChartJS -Type 'line' -Data $Data -Dataset @(
    New-UDChartJSDataset -DataProperty 'CPU' -Label 'ProcessName' -AdditionalOptions $Options
 ) -LabelProperty 'ProcessName'
Expected Output (top) versus Actual Rendering (bottom)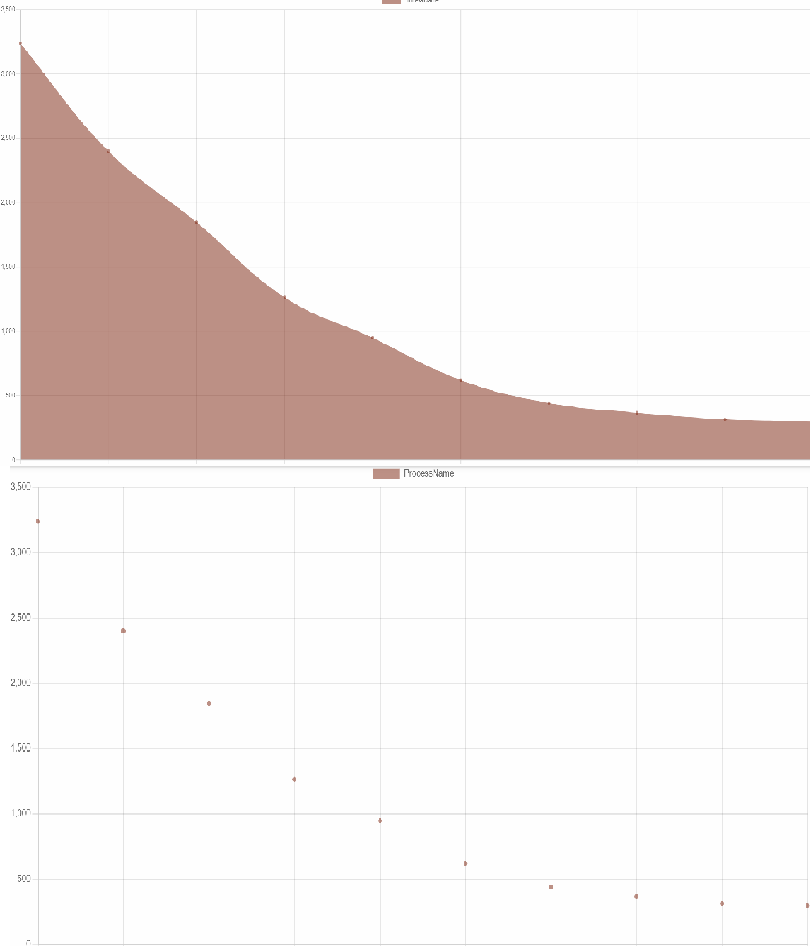
Setting the options explicitly as per above results in expected behaviour. The line charts render correctly in our 2.12.6 instance.
9e001f995a465ed8daf960f9ae2cfaf738f8babf.png
I just double checked and this seems to work fine.
New-UDDashboard -Content {
    $Data = Get-Process | Sort-Object -Property CPU -Descending | Select-Object -First 10
    $Options = @{
        fill = $true
        tension = 0.4
    }
    New-UDChartJS -Type 'line' -Data $Data -Dataset @(
        New-UDChartJSDataset -DataProperty 'CPU' -Label 'ProcessName' -AdditionalOptions $Options
    ) -LabelProperty 'ProcessName'
}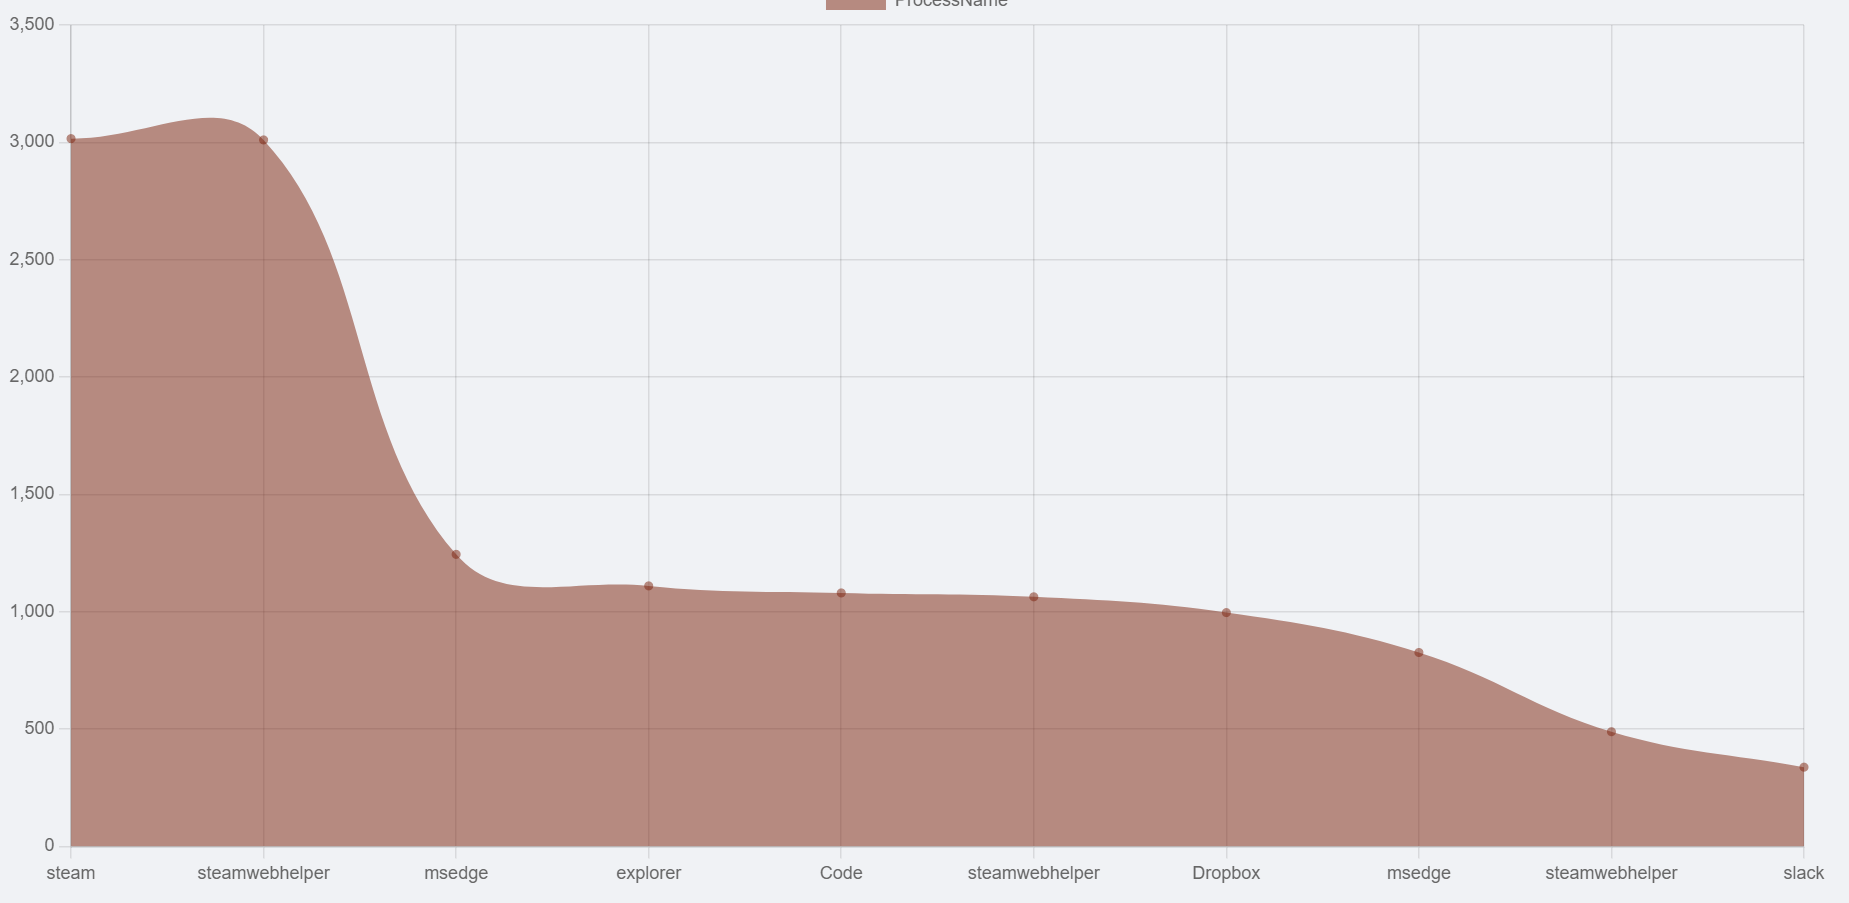
Also, what the heck is steam doing on my machine?
EDIT: Nevermind. I see what you are saying. This should work now.
    $Data = Get-Process | Sort-Object -Property CPU -Descending | Select-Object -First 10
    New-UDChartJS -Type 'line' -Data $Data -LabelProperty 'ProcessName' -DataProperty CPU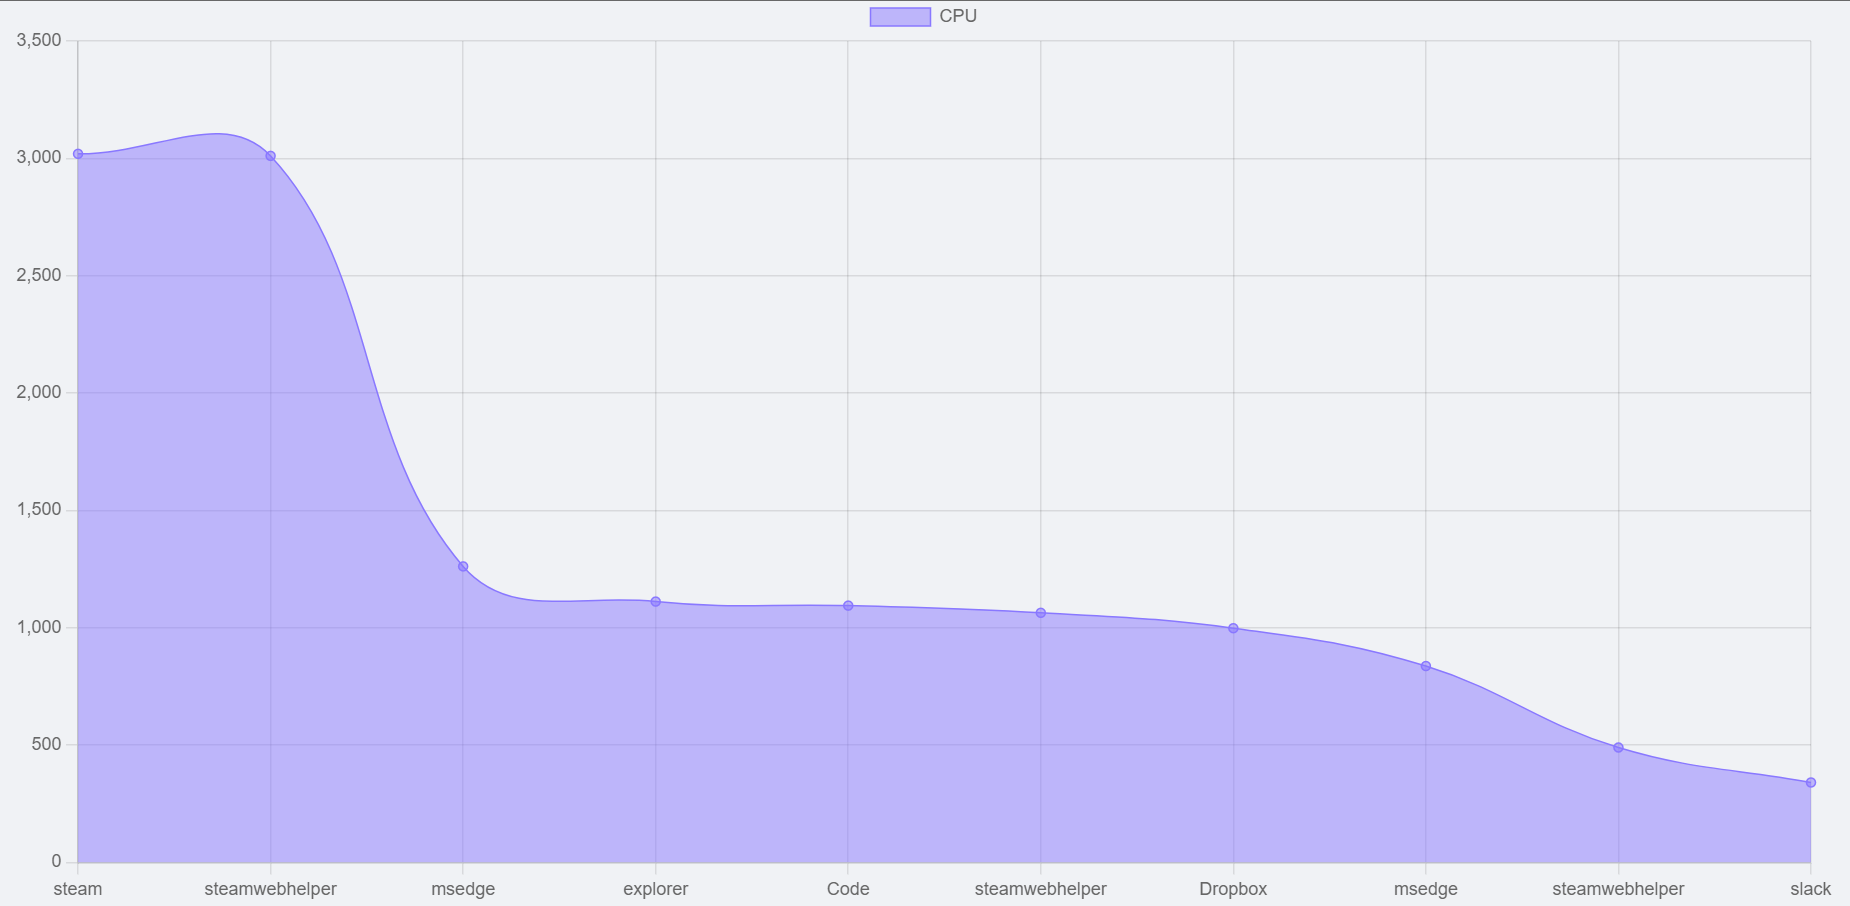
Adam Driscoll
PowerShell Expert and Developer at Devolutions
815315029723cb020910c2d29ab0399c2e14b9b3.png
3be209d57ba91513587788e93fb5d173ed22c292.png
Thanks Adam,
The issue would appear to be that the New-UDChartJSDataset now requires the -AdditionalOptions parameter to make the rendering consistent with 2.12.6.
We have added the following options:
$Options = @{
    fill = $true
    tension = 0.4
    borderWidth = 1
}
I don’t know if that was intended or not, but it’s fine now that we are aware of it. We have updated our charts accordingly.
Thanks for your assistance.