DVLS: Slow Performance since 2023.0.x
DVLS: 2023.2.6.0
RDM: 2023.2.25.0
Hi All
We noticed extremely slow Performance since we upgraded to DVLS 2023.2.x at 08.08.2023.
Slow Performance happens in RDM when loading Vaults configured with AD/Azure Group Permissions.
DVLS Web Performance seems quite OK.
Vault Config:
- Added 6 AD Groups (3x AD, 3x Azure) for Access
- 9 Subfolders with specified AD Group Permissions like this:
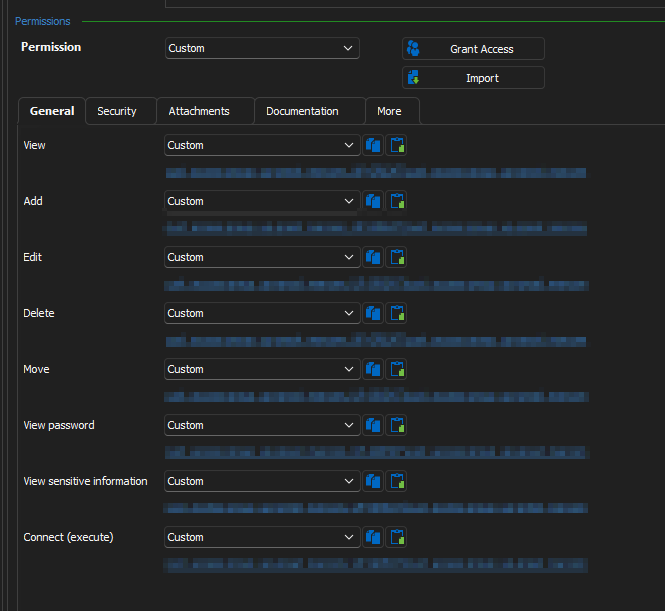
- Several Session Entries with specified Edit Permissions (also 2-4 AD/Azure Groups on each Session)
- All Users are working with Azure Accounts and Azure Group Permissions
Before Updating from 2023.1.x to 2023.2.x no user noticed Performance Issues.
DVLS is running on a Server 2019 with 8 Cores and 10GB RAM.
DVLS SQL DB is hosted on a SQL 2016.
What we tried:
- RAM Upgrade from 8GB to 10GB
- CPU Cores doubled from 4 to 8 Cores
- SQL Instance RAM Limit upgraded from 2GB to 8GB (-> was set fix to 2GB from initial Setup 2 Years ago, but the Instance still doesnt wants more than 2GB RAM)
- DVLS Update to 2023.2.6.0
- RDM Update when every RDM Update was released since 2023.2 Update
Test as User
- Opening a Vault needs 12-18 Seconds
Test as Admin
- Opening a Vault needs about 2 Seconds (!!!)
If i give Admin Rights to a User which has the Problem of slow loading Vaults, the Vaults are being loaded within 2-3 Seconds max.
What i noticed is the fact, that the CPU Load is very high since we updated.
Average CPU Load from Monitoring: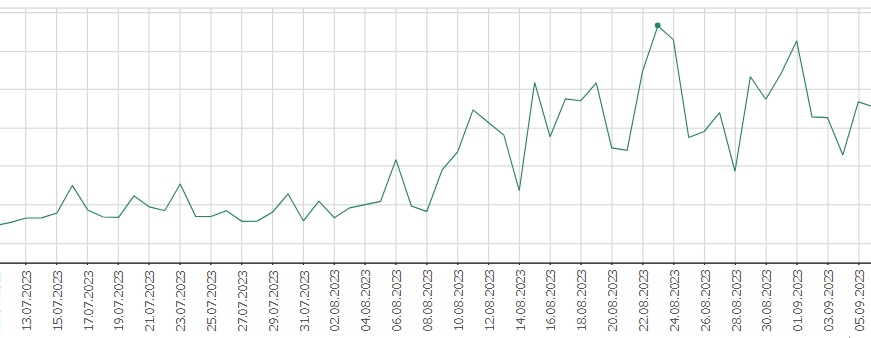
CPU Load from Taskmanager: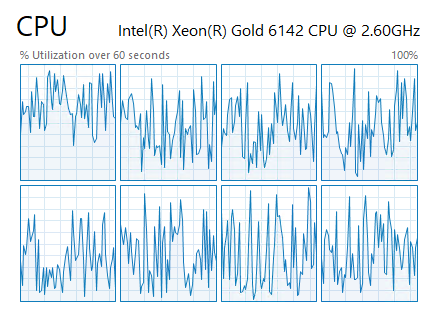
Is there a known Issue with RDM and DVLS since 2023.2.x?
Best Regards,
Andreas
b997fe6f-38c8-4462-baaa-9820eb41e411.png
16eae51b-1c88-4d5f-9a69-dcfeb43e2948.png
32a4c9d7-dc33-46de-991e-3f3ac0d65283.png
All Comments (24)
Hello Andreas,
Thank you for reporting this behaviour.
Is the Azure cache are enabled in your DVLS configuration?
Are the AD groups used for other specific user accounts other than the Azure users? Because DVLS is handling Domain and Azure authentication as 2 different identity providers, then an Azure user won't be affected by domain groups for the permissions.
We can investigate this during a support call. I will open a ticket and send you a link to book the session.
Best regards,
Érica Poirier
Dear Erica
Yes, Azure Cache is enabled.
We are using both Authentication Mechanisms because of AD only Accounts.
Best Regards,
Andreas
Hello Andreas,
As the DVLS can now communicate directly with Azure, usually the performance are better when the cache is disabled. Is it possible for you to disable it and check if standard users still experience slowness in RDM?
Best regards,
Érica Poirier
Hi Erica
Thanks for the Input.
I just tested it by disabling the Azure Cache feature and did a Cache reset.
A Vault change is still very, very slow for normal Users.
Best Regards,
Andreas
Hi Erica
We troubleshooted the System a little further and noticed the following:
- w3wp.exe Process has many KickOffThread's:
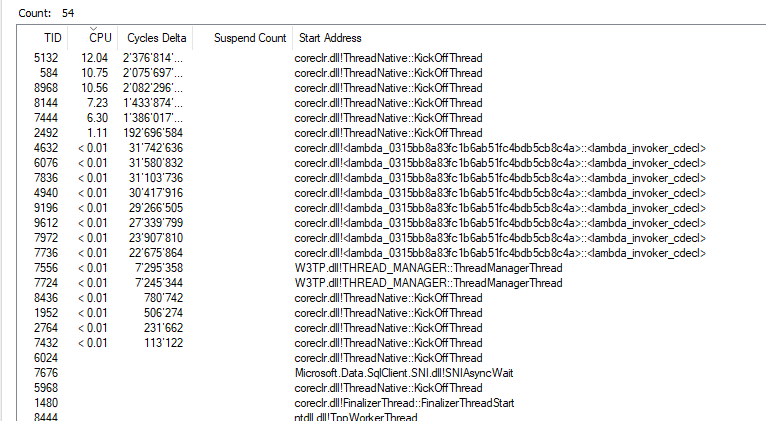
- CPU always flapps between 30 and 90% when the users are working (when
The interessting Thing is, w3wp Process has "only" 55-60 simultean Threads, but always kicks them off.
What i also checked or modified:
- disabled the DB Backup in DVLS settings and moved the process directly to the sql instance (PS: DVLS sql backup generates 12.8gb exports which are zipped to 2.9gb files, but direct sql exports are unzipped 3.2gb and needs < 60seconds to be created)
- same cpu/performance behaviour on fallback server when i switch the content in the loadbalancer
- started reindex in db
- tested with rdm 2023.1.29.0 -> same bad performance
- replaced all automated session icons from base64 (unique icons) to system icons -> still bad performance, but we think the performance increased a very little
- the sql instance now cosumes the fully 8gb ram which is good
I just wanted to test on our Test Environment the same Vault with and without AD/Azure Groups.
For that i started an Export of the Vault which currently only has 2024 Entries. This Export needed about 10 Minutes which is incredible slow for a simple export in my opinion (Export Size is only 10.9mb!).
I just imported the same Vault and recreated the whole Permissions on all Folders and the Vault is loading very fast.
The Test Database is running on the same Instance as the Prod System is running.
The only difference is that the Test doesnt has much Persons as on Prod System accessing it and the Test System has only a total of 4 Vaults.
Best Regards,
Andreas
7c990b2f-bc6e-46f6-8612-0d795109c573.png
Hello Andreas,
Another factor you must consider is that the production database logs are more important than your test database.
Does the ConnectionLog table contain a high number of records?
You can get the information with the Disk Usage by Top Tables report in SSMS.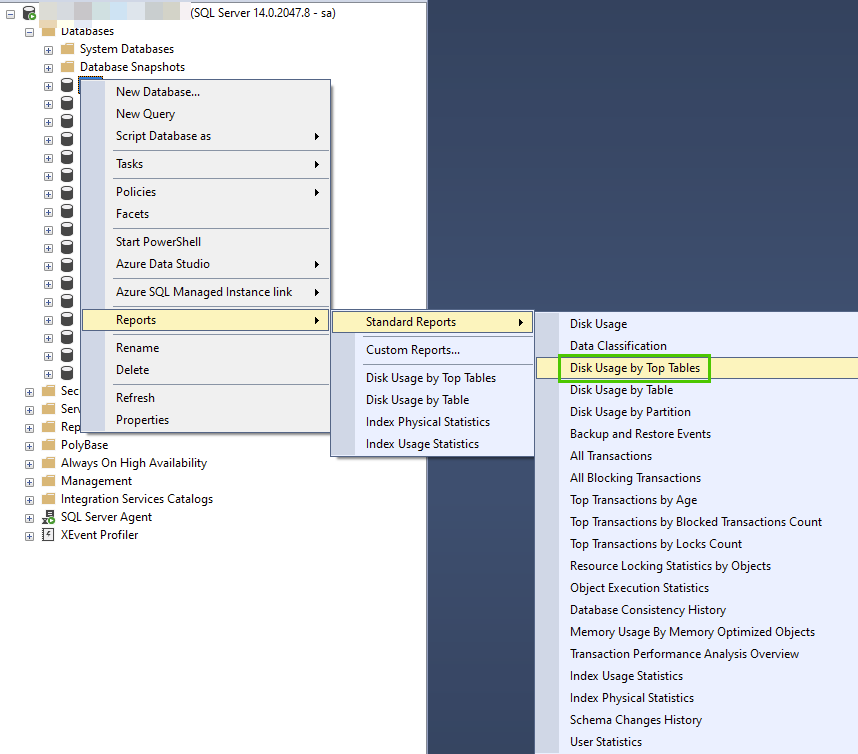
Best regards,
Érica Poirier
a4803681-b1ad-44c3-ac53-5a4dc7113710.png
Hi Erica
Here is a complete Report: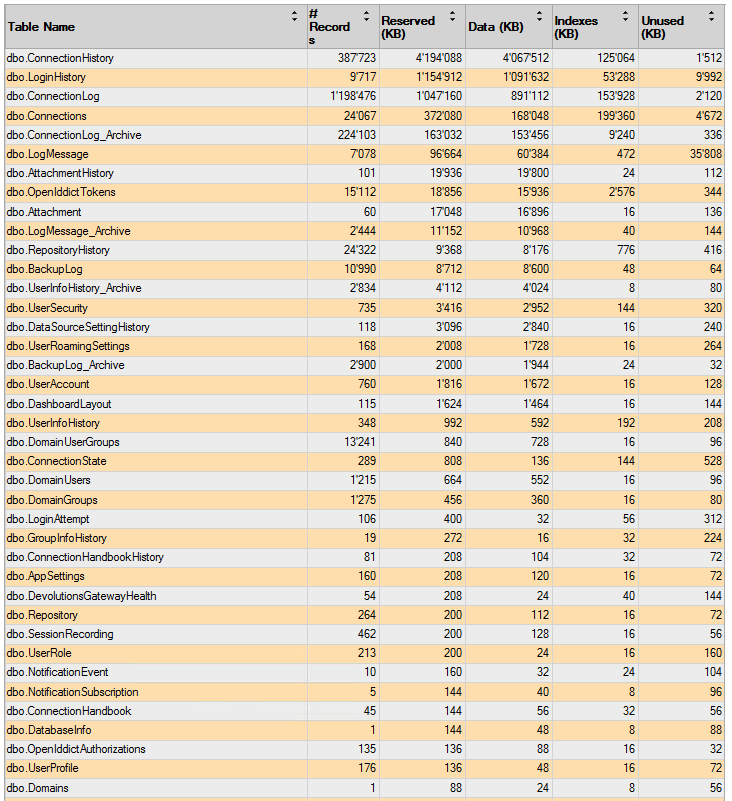
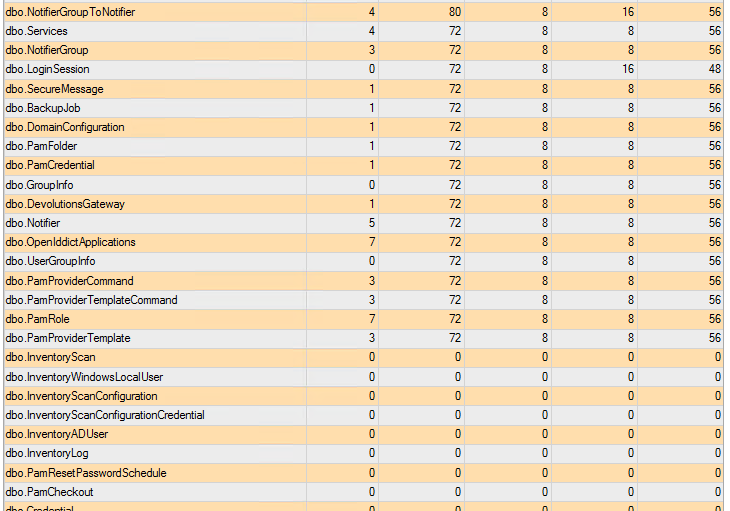
Here is a small Report with DB Size in MB: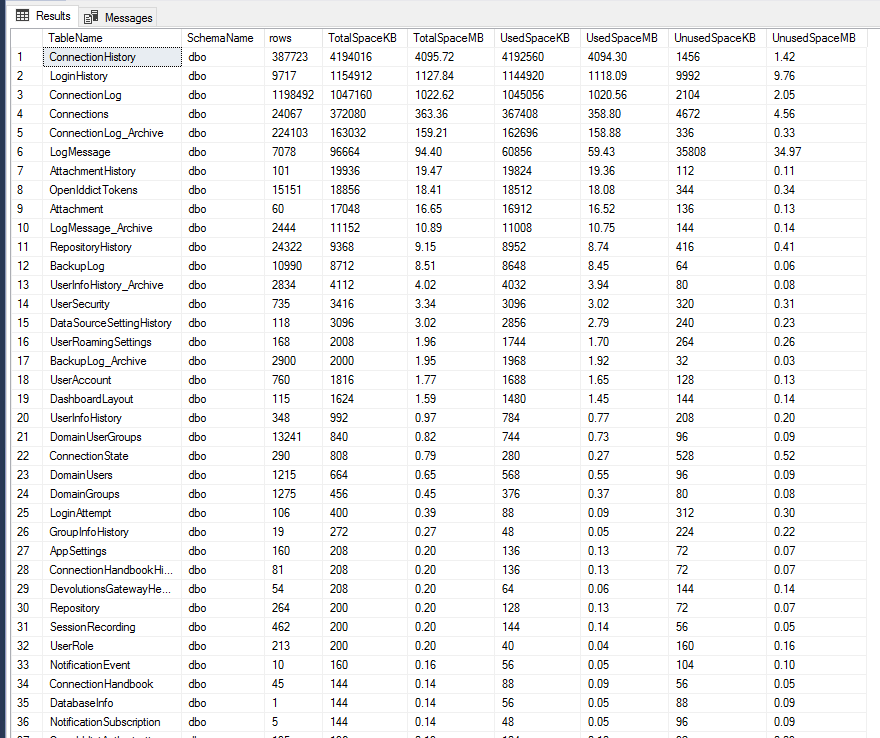
Do we need a small Cleanup to gain Performance?
Beware: We need all Users Connection Logs back to 1 Year.
Best Regards
Andreas
73a6d866-d2df-4af8-93cb-306c648ca55d.png
bfc6cb29-e386-45b9-b8d9-a5e9e7454e23.png
f048abe6-144d-4c91-a6da-7675454b133c.png
Hello Andreas,
Thank you for the information.
If the Cleanup Logs feature is already enabled and is set to archive logs older than one year, we could investigate what could create so many records in this table.
Do you use PowerShell scripts that create, update, and/or delete entries?
If so, then a solution would be to regularly remove the logs created by the PowerShell scripts using an SQL statement. Would this be a viable workaround?
Best regards,
Érica Poirier
Hi Erica
Yes, we have many Updates every Day done by powershell.
I have removed the Powershell User on Table ConnectionLog and ConnectionHistory (about 500k Entries).
The Performance Gain is about 40%.
I just reconfigured the Log Cleanup Function to Archive everything older than 1Month and delete everything older than 1 Year.
I will check if the Performance will be much better then.
Best Regards,
Andreas
Edit:
Cleanup is done, but the Performance did not increased very much.
Here is the current DB Size Compare: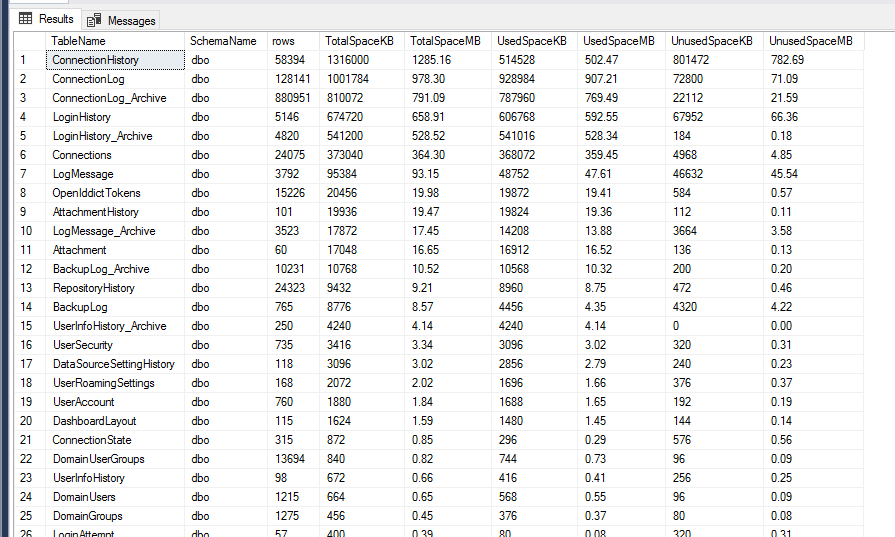
e312a265-0402-4a35-acf4-ccc1eb459053.png
Hello Andreas,
We have identified that the Connection State feature was causing the slowness. Once the ConnectionState table was cleaned up, RDM became responsive again, as expected.
The Automatic check in after option in Administration - System Settings - Vault Management should help to maintain the ConnectionState table healthy.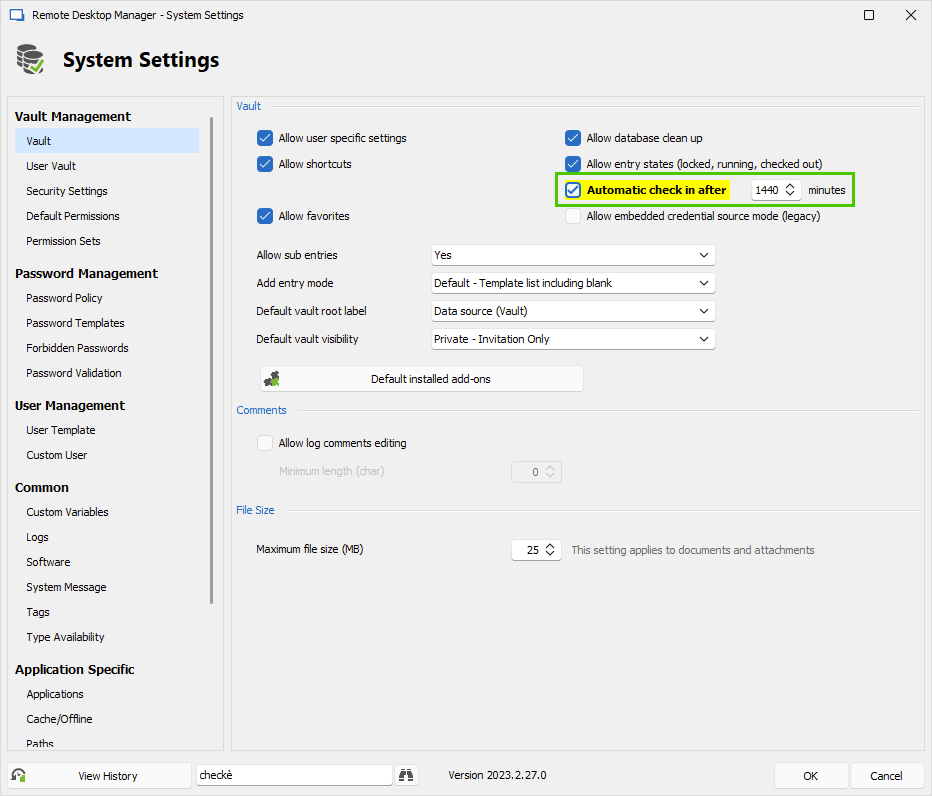
As mentioned during the support session, we will investigate on our end if we can reproduce this problem and if we can do something to fix this problem.
Best regards,
Érica Poirier
95b23245-4e03-4e07-bae3-6bc96dba921a.png
Hello Andreas,
Thank you for being so patient about this case.
We haven't been able to reproduce your slowness issue, even with multiple records in the ConnectionState table.
The next DVLS version will include more logs on how the connection state feature calls are done from RDM. Once it is available, we can have another support session to see if it the issue still exists.
Since our last session, have you experienced similar slowness in RDM?
Best regards,
Érica Poirier
Hi Erica
Ive created an SQL Job which deletes every 15minutes all entries from this table which are older than 2hours.
So since we had our last call, everything is pretty fast.
Best Regards,
Andreas
Hi Andreas,
Thank you for your feedback.
That's a nice workaround. But it doesn't help us to try to identify the root cause.
If you have any chance, disable your script once your DVLS is updated and see if the issue still occurs. If so, try to get the profiler report again to get these more detailed logs.
As always, thank you for your collaboration.
Best regards,
Érica Poirier
Hi Erica
Yes i see the point, but the System is Productive and the Users are really impatient when RDM is lagging again and i've implemented it because we have talked about this temp fix in the call.
But for now, i have allready updated to DVLS 2023.2.8.0, disabled the SQL Cleanup Job and informed all employees internally about the deactivation and am expecting feedback if performance deteriorates again.
I will gatter some Informations and come back to you later - maybe the final fix was just to cleanup the whole table once due an invalid entry...? Lets hope so 😊
Thanks again and best Regards,
Andreas
Hello Andreas,
Thank you very much for your collaboration. We understand that a system on production is critical.
We will then wait for your feedback about this.
Best regards,
Érica Poirier
RDM: 2023.2.32.0
DVLS: 2023.2.8.0
Dear Erica
Since ive disabled my Cleanup Script and activated the "automatic check in after 1440sec" function, we have currenty 126 Rows in the ConnectionState Table.
An Ugly thing about this is, that there are again 43 Entries from 3 Days ago.
But regarding to the Performance Issue, it looks like that it is not that bad as before (8 to 9 Seconds for loading 300 Entries), but it still slows down about 500 to 700ms only for those 126 rows.
This is manageable for us so far, but i will keep an eye open on this.
For the ugly old entries which tells us wrong opened sessions, i think i will re-enable my cleanup script after the Tests.
But for now i will keep it disabled and will hopefully get back about 300 Entries in the Database for check if it slows down again that much.
Best Regards,
Andreas
Edit: Profiler Level set to 264245
The Test Server which runs RDM is in the same Network on the same Hypervisor as the DVLS is running toget pure DVLS Loading time.
Log Output:
Thread : 11
----------------------------------------
11 - RootDashboardOverviewManager.LoadRootDashboardOverViewAsync - Full Load...
11 -     DVLS - Api - GetAccessRequests...
11 -         WebAPI.GetAccessRequests : 12 ms
11 -     DVLS - Api - GetAccessRequests : 12 ms
11 -     DVLS - Api - GetVaultAccessRequests...
11 -         WebAPI.GetVaultAccessRequests : 14 ms
11 -     DVLS - Api - GetVaultAccessRequests : 14 ms
11 -     DVLS - Api - GetTodoData...
11 -         WebAPI.GetTodoData : 22 ms
11 -     DVLS - Api - GetTodoData : 22 ms
11 - RootDashboardOverviewManager.LoadRootDashboardOverViewAsync - Full Load : 227 ms
11 - Connection States: Refresh...
11 -     ClearClosedRunning...
11 -         GetOpenedConnections...
11 -             Opened - by process : 5 ms
11 -         GetOpenedConnections : 5 ms
11 -     ClearClosedRunning : 5 ms
11 -     GetAllConnectionStates...
11 -         DVLS - Api - GetAllConnectionStates...
11 -             WebAPI.GetAllConnectionStates : 634 ms
11 -         DVLS - Api - GetAllConnectionStates : 634 ms
11 -     GetAllConnectionStates : 634 ms - Count : 18
11 - Connection States: Refresh : 640 ms

Thread : 14
----------------------------------------
14 - Connection States: Refresh...
14 -     ClearClosedRunning...
14 -         GetOpenedConnections...
14 -             Opened - by process : 4 ms
14 -         GetOpenedConnections : 4 ms
14 -     ClearClosedRunning : 4 ms
14 -     GetAllConnectionStates...
14 -         DVLS - Api - GetAllConnectionStates...
14 -             WebAPI.GetAllConnectionStates : 678 ms
14 -         DVLS - Api - GetAllConnectionStates : 678 ms
14 -     GetAllConnectionStates : 678 ms - Count : 18
14 -     Invoke Refresh : 15 ms
14 - Connection States: Refresh : 698 ms
14 - RootDashboardOverviewManager.LoadRootDashboardOverViewAsync - Full Load...
14 -     DVLS - Api - GetAccessRequests...
14 -         WebAPI.GetAccessRequests : 22 ms
14 -     DVLS - Api - GetAccessRequests : 22 ms
14 -     DVLS - Api - GetVaultAccessRequests...
14 -         WebAPI.GetVaultAccessRequests : 24 ms
14 -     DVLS - Api - GetVaultAccessRequests : 24 ms
14 -     DVLS - Api - GetTodoData...
14 -         WebAPI.GetTodoData : 17 ms
14 -     DVLS - Api - GetTodoData : 17 ms
14 - RootDashboardOverviewManager.LoadRootDashboardOverViewAsync - Full Load : 225 ms

Thread : 16
----------------------------------------
16 - Connection States: Refresh...
16 -     ClearClosedRunning...
16 -         GetOpenedConnections...
16 -             Opened - by process : 3 ms
16 -         GetOpenedConnections : 3 ms
16 -     ClearClosedRunning : 3 ms
16 -     GetAllConnectionStates...
16 -         DVLS - Api - GetAllConnectionStates...
16 -             WebAPI.GetAllConnectionStates : 587 ms
16 -         DVLS - Api - GetAllConnectionStates : 587 ms
16 -     GetAllConnectionStates : 588 ms - Count : 18
16 - Connection States: Refresh : 591 ms
16 - RootDashboardOverviewManager.LoadRootDashboardOverViewAsync - Full Load...
16 -     DVLS - Api - GetAccessRequests...
16 -         WebAPI.GetAccessRequests : 14 ms
16 -     DVLS - Api - GetAccessRequests : 14 ms
16 -     DVLS - Api - GetVaultAccessRequests...
16 -         WebAPI.GetVaultAccessRequests : 12 ms
16 -     DVLS - Api - GetVaultAccessRequests : 12 ms
16 -     DVLS - Api - GetTodoData...
16 -         WebAPI.GetTodoData : 17 ms
16 -     DVLS - Api - GetTodoData : 17 ms
16 - RootDashboardOverviewManager.LoadRootDashboardOverViewAsync - Full Load : 221 ms

Thread : 19
----------------------------------------
19 - RootDashboardOverviewManager.LoadRootDashboardOverViewAsync - Full Load...
19 -     DVLS - Api - GetAccessRequests...
19 -         WebAPI.GetAccessRequests : 18 ms
19 -     DVLS - Api - GetAccessRequests : 18 ms
19 -     DVLS - Api - GetVaultAccessRequests...
19 -         WebAPI.GetVaultAccessRequests : 13 ms
19 -     DVLS - Api - GetVaultAccessRequests : 14 ms
19 -     DVLS - Api - GetTodoData...
19 -         WebAPI.GetTodoData : 16 ms
19 -     DVLS - Api - GetTodoData : 16 ms
19 - RootDashboardOverviewManager.LoadRootDashboardOverViewAsync - Full Load : 250 ms

Thread : 20
----------------------------------------
20 - Connection States: Refresh...
20 -     ClearClosedRunning...
20 -         GetOpenedConnections...
20 -             Opened - by process : 3 ms
20 -         GetOpenedConnections : 3 ms
20 -     ClearClosedRunning : 3 ms
20 -     GetAllConnectionStates...
20 -         DVLS - Api - GetAllConnectionStates...
20 -             WebAPI.GetAllConnectionStates : 622 ms
20 -         DVLS - Api - GetAllConnectionStates : 622 ms
20 -     GetAllConnectionStates : 622 ms - Count : 18
20 - Connection States: Refresh : 625 ms
20 - RootDashboardOverviewManager.LoadRootDashboardOverViewAsync - Full Load...
20 -     DVLS - Api - GetAccessRequests...
20 -         WebAPI.GetAccessRequests : 14 ms
20 -     DVLS - Api - GetAccessRequests : 15 ms
20 -     DVLS - Api - GetVaultAccessRequests...
20 -         WebAPI.GetVaultAccessRequests : 12 ms
20 -     DVLS - Api - GetVaultAccessRequests : 12 ms
20 -     DVLS - Api - GetTodoData...
20 -         WebAPI.GetTodoData : 16 ms
20 -     DVLS - Api - GetTodoData : 16 ms
20 - RootDashboardOverviewManager.LoadRootDashboardOverViewAsync - Full Load : 189 ms
20 - Connection States: Refresh...
20 -     ClearClosedRunning...
20 -         GetOpenedConnections...
20 -             Opened - by process : 7 ms
20 -         GetOpenedConnections : 7 ms
20 -     ClearClosedRunning : 7 ms
20 -     GetAllConnectionStates...
20 -         DVLS - Api - GetAllConnectionStates...
20 -             WebAPI.GetAllConnectionStates : 651 ms
20 -         DVLS - Api - GetAllConnectionStates : 651 ms
20 -     GetAllConnectionStates : 651 ms - Count : 18
20 - Connection States: Refresh : 658 ms
20 - RootDashboardOverviewManager.LoadRootDashboardOverViewAsync - Full Load...
20 -     DVLS - Api - GetAccessRequests...
20 -         WebAPI.GetAccessRequests : 18 ms
20 -     DVLS - Api - GetAccessRequests : 18 ms
20 -     DVLS - Api - GetVaultAccessRequests...
20 -         WebAPI.GetVaultAccessRequests : 21 ms
20 -     DVLS - Api - GetVaultAccessRequests : 21 ms
20 -     DVLS - Api - GetTodoData...
20 -         WebAPI.GetTodoData : 22 ms
20 -     DVLS - Api - GetTodoData : 22 ms
20 - RootDashboardOverviewManager.LoadRootDashboardOverViewAsync - Full Load : 239 ms

Thread : 23
----------------------------------------
23 - RootDashboardOverviewManager.LoadRootDashboardOverViewAsync - Full Load...
23 -     DVLS - Api - GetAccessRequests...
23 -         WebAPI.GetAccessRequests : 23 ms
23 -     DVLS - Api - GetAccessRequests : 23 ms
23 -     DVLS - Api - GetVaultAccessRequests...
23 -         WebAPI.GetVaultAccessRequests : 14 ms
23 -     DVLS - Api - GetVaultAccessRequests : 14 ms
23 -     DVLS - Api - GetTodoData...
23 -         WebAPI.GetTodoData : 16 ms
23 -     DVLS - Api - GetTodoData : 16 ms
23 - RootDashboardOverviewManager.LoadRootDashboardOverViewAsync - Full Load : 202 ms
23 - Connection States: Refresh...
23 -     ClearClosedRunning...
23 -         GetOpenedConnections...
23 -             Opened - by process : 6 ms
23 -         GetOpenedConnections : 6 ms
23 -     ClearClosedRunning : 6 ms
23 -     GetAllConnectionStates...
23 -         DVLS - Api - GetAllConnectionStates...
23 -             WebAPI.GetAllConnectionStates : 579 ms
23 -         DVLS - Api - GetAllConnectionStates : 579 ms
23 -     GetAllConnectionStates : 579 ms - Count : 18
23 - Connection States: Refresh : 585 ms
23 - Connection States: Refresh...
23 -     ClearClosedRunning...
23 -         GetOpenedConnections...
23 -             Opened - by process : 6 ms
23 -         GetOpenedConnections : 6 ms
23 -     ClearClosedRunning : 6 ms
23 -     GetAllConnectionStates...
23 -         DVLS - Api - GetAllConnectionStates...
23 -             WebAPI.GetAllConnectionStates : 586 ms
23 -         DVLS - Api - GetAllConnectionStates : 586 ms
23 -     GetAllConnectionStates : 586 ms - Count : 18
23 - Connection States: Refresh : 592 ms
23 - Connection States: Refresh...
23 -     ClearClosedRunning...
23 -         GetOpenedConnections...
23 -             Opened - by process : 5 ms
23 -         GetOpenedConnections : 5 ms
23 -     ClearClosedRunning : 6 ms
23 -     GetAllConnectionStates...
23 -         DVLS - Api - GetAllConnectionStates...
23 -             WebAPI.GetAllConnectionStates : 624 ms
23 -         DVLS - Api - GetAllConnectionStates : 624 ms
23 -     GetAllConnectionStates : 624 ms - Count : 18
23 - Connection States: Refresh : 630 ms
Hello Andreas,
Thank you for your feedback and the profiling report.
As you mentioned, loading the records from the ConnectionState table doesn't take much time, but it's only for a few records.
Let us know if things get worse!
Thank you for your collaboration.
Best regards,
Érica Poirier
Dear Erica
Looks like that the Entries in Database are not growing very much anymore.
Currently we have 122 Rows, but there are still Entries from 27.09.2023.
But im not sure if the Performance is dropping every Day a little bit more:
Thread : 9
----------------------------------------
9 - Connection States: Refresh...
9 -     ClearClosedRunning...
9 -         GetOpenedConnections...
9 -             Opened - by process...
9 -                 NX Client : 1 ms
9 -             Opened - by process : 6 ms
9 -         GetOpenedConnections : 6 ms
9 -     ClearClosedRunning : 6 ms
9 -     GetAllConnectionStates...
9 -         DVLS - Api - GetAllConnectionStates...
9 -             WebAPI.GetAllConnectionStates : 848 ms
9 -         DVLS - Api - GetAllConnectionStates : 848 ms
9 -     GetAllConnectionStates : 848 ms - Count : 28
9 - Connection States: Refresh : 855 ms

Thread : 16
----------------------------------------
16 - Connection States: Refresh...
16 -     ClearClosedRunning...
16 -         GetOpenedConnections...
16 -             Opened - by process : 5 ms
16 -         GetOpenedConnections : 5 ms
16 -     ClearClosedRunning : 5 ms
16 -     GetAllConnectionStates...
16 -         DVLS - Api - GetAllConnectionStates...
16 -             WebAPI.GetAllConnectionStates : 969 ms
16 -         DVLS - Api - GetAllConnectionStates : 969 ms
16 -     GetAllConnectionStates : 969 ms - Count : 28
16 - Connection States: Refresh : 974 ms

Thread : 23
----------------------------------------
23 - Connection States: Refresh...
23 -     ClearClosedRunning...
23 -         GetOpenedConnections...
23 -             Opened - by process : 5 ms
23 -         GetOpenedConnections : 5 ms
23 -     ClearClosedRunning : 5 ms
23 -     GetAllConnectionStates...
23 -         DVLS - Api - GetAllConnectionStates...
23 -             WebAPI.GetAllConnectionStates : 1050 ms
23 -         DVLS - Api - GetAllConnectionStates : 1050 ms
23 -     GetAllConnectionStates : 1050 ms - Count : 28
23 - Connection States: Refresh : 1055 ms
23 - RootDashboardOverviewManager.LoadRootDashboardOverViewAsync - Full Load...
23 -     DVLS - Api - GetAccessRequests...
23 -         WebAPI.GetAccessRequests : 12 ms
23 -     DVLS - Api - GetAccessRequests : 12 ms
23 -     DVLS - Api - GetVaultAccessRequests...
23 -         WebAPI.GetVaultAccessRequests : 14 ms
23 -     DVLS - Api - GetVaultAccessRequests : 14 ms
23 -     DVLS - Api - GetTodoData...
23 -         WebAPI.GetTodoData : 17 ms
23 -     DVLS - Api - GetTodoData : 17 ms
23 - RootDashboardOverviewManager.LoadRootDashboardOverViewAsync - Full Load : 240 ms
Another Vault:
Thread : 23
----------------------------------------
23 - Connection States: Refresh...
23 -     ClearClosedRunning...
23 -         GetOpenedConnections...
23 -             Opened - by process : 8 ms
23 -         GetOpenedConnections : 8 ms
23 -     ClearClosedRunning : 9 ms
23 -     GetAllConnectionStates...
23 -         DVLS - Api - GetAllConnectionStates...
23 -             WebAPI.GetAllConnectionStates : 848 ms
23 -         DVLS - Api - GetAllConnectionStates : 848 ms
23 -     GetAllConnectionStates : 848 ms - Count : 26
23 - Connection States: Refresh : 857 ms
23 - Connection States: Refresh...
23 -     ClearClosedRunning...
23 -         GetOpenedConnections...
23 -             Opened - by process : 5 ms
23 -         GetOpenedConnections : 5 ms
23 -     ClearClosedRunning : 5 ms
23 -     GetAllConnectionStates...
23 -         DVLS - Api - GetAllConnectionStates...
23 -             WebAPI.GetAllConnectionStates : 710 ms
23 -         DVLS - Api - GetAllConnectionStates : 711 ms
23 -     GetAllConnectionStates : 711 ms - Count : 25
23 - Connection States: Refresh : 716 ms

Thread : 27
----------------------------------------
27 - Connection States: Refresh...
27 -     ClearClosedRunning...
27 -         GetOpenedConnections...
27 -             Opened - by process : 7 ms
27 -         GetOpenedConnections : 7 ms
27 -         DVLS - Api - MarkAsClosed...
27 -             WebAPI.MarkAsClosed : 193 ms
27 -         DVLS - Api - MarkAsClosed : 193 ms
27 -     ClearClosedRunning : 201 ms
27 -     GetAllConnectionStates...
27 -         DVLS - Api - GetAllConnectionStates...
27 -             WebAPI.GetAllConnectionStates : 891 ms
27 -         DVLS - Api - GetAllConnectionStates : 891 ms
27 -     GetAllConnectionStates : 891 ms - Count : 25
27 - Connection States: Refresh : 1092 ms
I've now just removed all Entries from the Table (126 Rows).
Looks pretty like a Calculation Bug in RDM for me:
Thread : 30
----------------------------------------
30 - Connection States: Refresh...
30 -     GetAllConnectionStates...
30 -         DVLS - Api - GetAllConnectionStates...
30 -             WebAPI.GetAllConnectionStates : 15 ms
30 -         DVLS - Api - GetAllConnectionStates : 15 ms
30 -     GetAllConnectionStates : 15 ms
30 - Connection States: Refresh : 15 ms
30 - RootDashboardOverviewManager.LoadRootDashboardOverViewAsync - Full Load...
30 -     DVLS - Api - GetAccessRequests...
30 -         WebAPI.GetAccessRequests : 12 ms
30 -     DVLS - Api - GetAccessRequests : 12 ms
30 -     DVLS - Api - GetVaultAccessRequests...
30 -         WebAPI.GetVaultAccessRequests : 23 ms
30 -     DVLS - Api - GetVaultAccessRequests : 23 ms
30 -     DVLS - Api - GetTodoData...
30 -         WebAPI.GetTodoData : 39 ms
30 -     DVLS - Api - GetTodoData : 39 ms
30 - RootDashboardOverviewManager.LoadRootDashboardOverViewAsync - Full Load : 278 ms
Best Regards,
Andreas
Dear Erica
FYI:
Today some Peoples came to me because the Speed decreased really much.
After activating directly the Profiler on Employee Computer, it displayed 5500 up to 6800ms loading time for GetAllConnectionStates.
The Database contained 177 Entries.
After i reactivated the DB Cleanup Script which deletes all Entries older then 2hours, there was only 55 Entries in DB left and the Speed increased to 700ms.
For now as Dirty-Fix, i will let the Script activated so every 15mins a Cleanup is done.
Best Regards,
Andreas
Hello Andreas,
Thank you for your update on this.
As mentioned in a previous post, the latest DVLS version 2023.2.9 and RDM 2023.2.32 contain more logs for the GetAllConnectionStates call in the profiling tool.
It would be interesting once you update DVLS and RDM to their latest versions to try it again and send us another profiling report when the issue is ongoing. We understand that this affects your production environment, and users will be directly impacted.
In the meantime, I will send your latest report to our development team.
Thank you for your collaboration.
Best regards,
Érica Poirier
As mentioned in a previous post, the latest DVLS version 2023.2.9 and RDM 2023.2.32 contain more logs for the GetAllConnectionStates call in the profiling tool.
Dear Erica
On your latest Post about this, the newest DVLS Version was 2023.2.8. So all Tests since then was done with DVLS 2023.2.8 and RDM 2023.2.32 as i already wrote.
If you need additional Profiles Informations, you need to specify which Options i need to activate.
I will update and disable the Cleanup Job ASAP.
Thanks and best Regards,
Andreas
Edit: I think i missunderstand your latest Post about this Erica. You wrote about "next Release" and not the "Current Release".
Sorry about that. I have just updated and disabled the SQL Cleanup Job. As soon we have more Entries in DB and the Connection is slowing down, i will rerun the Profiler to get you more Logs.
But can you please tell me, which Options i need to acitvate for your needs?
Here are the current Logs with cleaned Up Entries and already slowing down Reconnecting Times (Profiles Level 264245).
Best Regards, Andreas
Main thread (UI)
----------------------------------------
09:38:47.938114	REMOTE:    GET - /api/security/repositories/550ac47d-e6b0-46e6-9739-d68d150257ae/cachevalues : 33 ms
09:38:47.938114	RefreshConnections...
09:38:47.938114	    LoadConnections UI - [Devolutions Server : {Company Name}] - Disabled - 64-bit...
09:38:47.938114	        HasSecurityChanged...
09:38:47.938114	            DVLS - Api - GetCacheValues...
09:38:47.938114	                WebAPI.GetCacheValues : 91 ms
09:38:47.938114	            DVLS - Api - GetCacheValues : 92 ms
09:38:47.938114	        HasSecurityChanged : 92 ms
09:38:47.939067	        Reload: False - HasSecurityChanged: True - HasChanged: True
09:38:47.957062	        RefreshUserSecurityContext...
09:38:47.957062	            DVLS - Api - GetCurrentUser...
09:38:47.957062	                WebAPI.GetCurrentUser...
09:38:47.957062	                    DVLS - Api - GetPublicWebInstanceInformation : 17 ms
09:38:47.980066	                    DVLS - Api - GetPrivateWebInstanceInformation : 22 ms
09:38:48.211065	REMOTE:   POST - /api/security/currentuser...
09:38:48.211065	REMOTE:     GetCurrentUser...
09:38:48.211065	REMOTE:         UserManager.GetUser : 0 ms
09:38:48.211065	REMOTE:         LoginManager.InitRoles : 32 ms
09:38:48.211065	REMOTE:         SessionManager.SetCurrentUser : 2 ms
09:38:48.211065	REMOTE:     GetCurrentUser : 171 ms
09:38:48.211065	REMOTE:   POST - /api/security/currentuser : 172 ms
09:38:48.211065	                WebAPI.GetCurrentUser : 270 ms
09:38:48.211065	            DVLS - Api - GetCurrentUser : 271 ms
09:38:48.211065	        RefreshUserSecurityContext : 272 ms
09:38:48.211065	        Engine.Clear - DisposeInternalList - ClearRoot : 0 ms
09:38:48.283146	REMOTE:    GET - /api/security/repositories : 0 ms
09:38:48.283146	        LoadConnectionsFromDataSource...
09:38:48.283146	            LoadDataSourceSettingsFromDataSource...
09:38:48.283146	                GetDataSourceSettings...
09:38:48.283146	                    DVLS - Api - GetRepositories...
09:38:48.283146	                        WebAPI.GetRepositories : 70 ms
09:38:48.283146	                    DVLS - Api - GetRepositories : 71 ms
09:38:48.743074	REMOTE:   POST - /api/data-source-settings/entity...
09:38:48.743074	REMOTE:     GetConnectionsWithRolesForRepository...
09:38:48.743074	REMOTE:         Filter version : 0 ms
09:38:48.743074	REMOTE:         Filter security : 113 ms
09:38:48.743074	REMOTE:         GetConnectionsForRepositories : 24 ms
09:38:48.743074	REMOTE:     GetConnectionsWithRolesForRepository : 169 ms
09:38:48.743074	REMOTE:   POST - /api/data-source-settings/entity : 231 ms
09:38:48.743074	                    DVLS - Api - GetData...
09:38:48.743074	                        WebAPI.GetData : 460 ms
09:38:48.743074	                    DVLS - Api - GetData : 460 ms - Count : 452
09:38:48.750075	                GetDataSourceSettings : 538 ms
09:38:48.750075	            LoadDataSourceSettingsFromDataSource : 538 ms
09:38:48.767075	REMOTE:    GET - /api/security/roles : 0 ms
09:38:48.767075	            DVLS - Api - GetRoles...
09:38:48.767075	                WebAPI.GetRoles : 15 ms
09:38:48.767075	            DVLS - Api - GetRoles : 15 ms
09:38:48.781074	REMOTE:    GET - /api/security/repositories : 0 ms
09:38:48.781074	            DVLS - Api - GetRepositories...
09:38:48.781074	                WebAPI.GetRepositories : 12 ms
09:38:48.781074	            DVLS - Api - GetRepositories : 12 ms
09:38:48.846077	REMOTE:    GET - /api/security/repositories/550ac47d-e6b0-46e6-9739-d68d150257ae : 49 ms
09:38:48.846077	            DVLS - Api - GetRepository...
09:38:48.846077	                WebAPI.GetRepository : 61 ms
09:38:48.846077	            DVLS - Api - GetRepository : 61 ms
09:38:48.849073	            GetConnections...
09:38:48.849073	                RDMS.GetConnections...
09:38:48.849073	                    ConnectionInfos.Foreach...
09:38:48.849073	                        DecryptData : 1 ms - Count : 452
09:38:48.879082	                        DeserializeData : 29 ms - Count : 330
09:38:48.883080	                    ConnectionInfos.Foreach : 34 ms
09:38:48.883080	                    Fetched 330 sessions
09:38:48.883080	                    Fetched 122 removed sessions
09:38:48.883080	                RDMS.GetConnections : 34 ms
09:38:48.883080	            GetConnections : 34 ms
09:38:48.886077	            DoMergeConnections - Disabled...
09:38:48.886077	                PrepareConnectionList : 3 ms
09:38:48.893077	                Loop...
09:38:48.893077	                    Merge With List : 4 ms
09:38:48.893077	                Loop : 6 ms
09:38:48.907081	REMOTE:    GET - /api/security/groupinfos : 0 ms
09:38:48.907081	                Filter...
09:38:48.907081	                    DVLS - Api - GetGroupInfos...
09:38:48.907081	                        WebAPI.GetGroupInfos : 12 ms
09:38:48.907081	                    DVLS - Api - GetGroupInfos : 12 ms
09:38:48.908080	                Filter : 14 ms
09:38:48.908080	            DoMergeConnections - Disabled : 25 ms
09:38:48.908080	        LoadConnectionsFromDataSource : 696 ms
09:38:48.921079	REMOTE:    GET - /api/security/connectionoverrides/hash : 0 ms
09:38:48.921079	        Load connection overrides...
09:38:48.921079	            Has changes...
09:38:48.921079	                DVLS - Api - GetConnectionOverridesHash...
09:38:48.921079	                    WebAPI.GetConnectionOverridesHash : 13 ms
09:38:48.921079	                DVLS - Api - GetConnectionOverridesHash : 13 ms
09:38:48.921079	            Has changes : 13 ms
09:38:48.921079	        Load connection overrides : 13 ms
09:38:48.974081	        LoadConnections [Devolutions Server : {Company Name} - Global Vault] - Disabled - 64-bit : 52 ms
09:38:48.998078	REMOTE:   POST - /api/security/users/roaming-settings : 0 ms
09:38:48.998078	        FavoriteManager.LoadFolders...
09:38:48.998078	            DVLS - Api - GetUserRoamingSettings...
09:38:48.998078	                WebAPI.GetUserRoamingSettings : 19 ms
09:38:48.998078	            DVLS - Api - GetUserRoamingSettings : 19 ms
09:38:49.000079	        FavoriteManager.LoadFolders : 24 ms
09:38:49.039080	REMOTE:    GET - /api/secure-messages : 22 ms
09:38:49.039080	        DVLS - Api - GetSecureMessages...
09:38:49.039080	            WebAPI.GetSecureMessages : 36 ms
09:38:49.039080	        DVLS - Api - GetSecureMessages : 36 ms
09:38:49.039080	    LoadConnections UI - [Devolutions Server : {Company Name}] - Disabled - 64-bit : 1193 ms
09:38:49.039080	RefreshConnections : 1193 ms
09:38:49.050080	Connection States: Refresh...
09:38:49.050080	    ClearClosedRunning...
09:38:49.050080	        GetOpenedConnections...
09:38:49.050080	            Opened - by process...
09:38:49.050080	                RDP (Microsoft Remote Desktop) : 2 ms
09:38:49.053076	                VMware (Player, Workstation, vSphere) : 1 ms
09:38:49.054078	            Opened - by process : 15 ms
09:38:49.054078	        GetOpenedConnections : 15 ms
09:38:49.055080	    ClearClosedRunning : 15 ms
09:38:49.927093	REMOTE:    GET - /api/connection/states...
09:38:49.927093	REMOTE:     RefreshConnections : 0 ms
09:38:49.927093	REMOTE:     GetAllConnectionStates...
09:38:49.927093	REMOTE:         GetAllConnectionStates.CanView : 850 ms - Count : 20
09:38:49.927093	REMOTE:     GetAllConnectionStates : 851 ms
09:38:49.927093	REMOTE:    GET - /api/connection/states : 852 ms
09:38:49.927093	    GetAllConnectionStates...
09:38:49.927093	        DVLS - Api - GetAllConnectionStates...
09:38:49.927093	            WebAPI.GetAllConnectionStates : 871 ms
09:38:49.927093	        DVLS - Api - GetAllConnectionStates : 871 ms
09:38:49.927093	    GetAllConnectionStates : 871 ms - Count : 20
09:38:49.948093	    Invoke Refresh : 21 ms
09:38:49.948093	Connection States: Refresh : 909 ms
09:38:49.961091	TreeView.LoadConnectionList...
09:38:49.961091	    BeginUpdate...
09:38:49.962092	        LoadConnectionInTreeNode : 2 ms
09:38:49.962092	        PreCreateGroups : 0 ms - Run count : 1
09:38:49.962092	    BeginUpdate : 13 ms
09:38:49.962092	TreeView.LoadConnectionList : 13 ms
09:38:49.962092	Load Expand States...
09:38:49.962092	    Expanded: 3 - Nodes : 330
09:38:49.962092	    Nodes...
09:38:49.962092	        Expand : 0 ms - Run count : 1
09:38:49.962092	        Collapse : 0 ms - Run count : 15
09:38:49.962092	    Nodes : 0 ms
09:38:49.962092	Load Expand States : 0 ms
09:38:50.280102	SelectionChanged - Default...
09:38:50.281092	    RootDashboardOverviewManager.LoadRootDashboardOverView - Quick Load...
09:38:50.281092	        Set DocumentText : 2 ms
09:38:50.281092	    RootDashboardOverviewManager.LoadRootDashboardOverView - Quick Load : 194 ms
09:38:50.294098	SelectionChanged - Default : 208 ms
09:38:50.295098	REMOTE:    GET - /api/accessrequest/all : 0 ms
09:38:50.307098	REMOTE:    GET - /api/repository-access-request : 1 ms
09:38:50.322094	REMOTE:   POST - /api/todo/get-todo-data : 1 ms
09:38:51.676925	REMOTE:    GET - /api/accessrequest/all : 0 ms
09:38:51.699953	REMOTE:    GET - /api/repository-access-request : 1 ms
09:38:51.727660	REMOTE:   POST - /api/todo/get-todo-data : 1 ms
09:39:47.951317	REMOTE:    GET - /api/connection/states...
09:39:47.951317	REMOTE:     RefreshConnections : 2 ms
09:39:47.951317	REMOTE:     GetAllConnectionStates...
09:39:47.951317	REMOTE:         GetAllConnectionStates.CanView : 630 ms - Count : 20
09:39:47.951317	REMOTE:     GetAllConnectionStates : 632 ms
09:39:47.951317	REMOTE:    GET - /api/connection/states : 634 ms
09:39:51.705361	REMOTE:    GET - /api/accessrequest/all : 1 ms
09:39:51.731360	REMOTE:    GET - /api/repository-access-request : 1 ms
09:39:51.757359	REMOTE:   POST - /api/todo/get-todo-data : 2 ms

Thread : 13
----------------------------------------
13 - 09:38:51.676925	RootDashboardOverviewManager.LoadRootDashboardOverViewAsync - Full Load...
13 - 09:38:51.676925	    DVLS - Api - GetAccessRequests...
13 - 09:38:51.676925	        WebAPI.GetAccessRequests : 15 ms
13 - 09:38:51.676925	    DVLS - Api - GetAccessRequests : 15 ms
13 - 09:38:51.699953	    DVLS - Api - GetVaultAccessRequests...
13 - 09:38:51.699953	        WebAPI.GetVaultAccessRequests : 22 ms
13 - 09:38:51.699953	    DVLS - Api - GetVaultAccessRequests : 22 ms
13 - 09:38:51.727660	    DVLS - Api - GetTodoData...
13 - 09:38:51.727660	        WebAPI.GetTodoData : 25 ms
13 - 09:38:51.727660	    DVLS - Api - GetTodoData : 25 ms
13 - 09:38:51.947932	RootDashboardOverviewManager.LoadRootDashboardOverViewAsync - Full Load : 287 ms

Thread : 14
----------------------------------------
14 - 09:39:51.705361	RootDashboardOverviewManager.LoadRootDashboardOverViewAsync - Full Load...
14 - 09:39:51.705361	    DVLS - Api - GetAccessRequests...
14 - 09:39:51.705361	        WebAPI.GetAccessRequests : 17 ms
14 - 09:39:51.705361	    DVLS - Api - GetAccessRequests : 17 ms
14 - 09:39:51.731360	    DVLS - Api - GetVaultAccessRequests...
14 - 09:39:51.731360	        WebAPI.GetVaultAccessRequests : 25 ms
14 - 09:39:51.731360	    DVLS - Api - GetVaultAccessRequests : 25 ms
14 - 09:39:51.757359	    DVLS - Api - GetTodoData...
14 - 09:39:51.757359	        WebAPI.GetTodoData : 26 ms
14 - 09:39:51.757359	    DVLS - Api - GetTodoData : 26 ms
14 - 09:39:51.969365	RootDashboardOverviewManager.LoadRootDashboardOverViewAsync - Full Load : 282 ms

Thread : 18
----------------------------------------
18 - 09:38:50.295098	RootDashboardOverviewManager.LoadRootDashboardOverViewAsync - Full Load...
18 - 09:38:50.295098	    DVLS - Api - GetAccessRequests...
18 - 09:38:50.295098	        WebAPI.GetAccessRequests : 13 ms
18 - 09:38:50.295098	    DVLS - Api - GetAccessRequests : 13 ms
18 - 09:38:50.307098	    DVLS - Api - GetVaultAccessRequests...
18 - 09:38:50.307098	        WebAPI.GetVaultAccessRequests : 12 ms
18 - 09:38:50.307098	    DVLS - Api - GetVaultAccessRequests : 12 ms
18 - 09:38:50.324386	    DVLS - Api - GetTodoData...
18 - 09:38:50.324386	        WebAPI.GetTodoData : 16 ms
18 - 09:38:50.324386	    DVLS - Api - GetTodoData : 16 ms
18 - 09:38:50.525100	RootDashboardOverviewManager.LoadRootDashboardOverViewAsync - Full Load : 244 ms
18 - 09:39:47.285760	Connection States: Refresh...
18 - 09:39:47.285760	    ClearClosedRunning...
18 - 09:39:47.285760	        GetOpenedConnections...
18 - 09:39:47.285760	            Opened - by process : 8 ms
18 - 09:39:47.285760	        GetOpenedConnections : 8 ms
18 - 09:39:47.285760	    ClearClosedRunning : 8 ms
18 - 09:39:47.951317	    GetAllConnectionStates...
18 - 09:39:47.951317	        DVLS - Api - GetAllConnectionStates...
18 - 09:39:47.951317	            WebAPI.GetAllConnectionStates : 665 ms
18 - 09:39:47.951317	        DVLS - Api - GetAllConnectionStates : 665 ms
18 - 09:39:47.951317	    GetAllConnectionStates : 665 ms - Count : 20
18 - 09:39:47.951317 Connection States: Refresh : 674 msHello Andreas,
The DVLS version 2023.2.9 is available. Have you tested it and gotten different results with more information than your previous profiling report?
Best regards,
Érica Poirier
Hi Erica
Yes, the latest Test was already with 2023.2.9.
But ive tested just some Minutes ago with an employee by switching 2 Vaults.
One Time i got a Timeout, but the other about 8-10 Switches was always between 1.8 and 2.6 Seconds.
Currently we have 154 Rows in ConnectionState Table. Oldest Entry is from 2023-10-05 09:41:36.
Here is the Timeout:
Main thread (UI)
----------------------------------------
RefreshConnections...
    LoadConnections UI - [Devolutions Server : {ServerName}] - Disabled - 64-bit...
        HasSecurityChanged...
            DVLS - Api - GetCacheValues...
                WebAPI.GetCacheValues : 192 ms
            DVLS - Api - GetCacheValues : 192 ms
        HasSecurityChanged : 192 ms
        Reload: False - HasSecurityChanged: False - HasChanged: True
        LoadConnectionsFromDataSource...
            LoadDataSourceSettingsFromDataSource...
                GetDataSourceSettings...
                    DVLS - Api - GetRepositories...
                        WebAPI.GetRepositories : 60 ms
                    DVLS - Api - GetRepositories : 60 ms
                    DVLS - Api - GetData...
                        WebAPI.GetData : 634 ms
                    DVLS - Api - GetData : 635 ms - Count : 76
                GetDataSourceSettings : 697 ms
            LoadDataSourceSettingsFromDataSource : 697 ms
            DVLS - Api - GetRepositories...
                WebAPI.GetRepositories : 50 ms
            DVLS - Api - GetRepositories : 50 ms
            GetConnections...
                RDMS.GetConnections...
                    ConnectionInfos.Foreach...
                        DecryptData : 0 ms - Count : 76
                    ConnectionInfos.Foreach : 1 ms
                    Fetched 0 sessions
                    Fetched 76 removed sessions
                RDMS.GetConnections : 1 ms
            GetConnections : 1 ms
            DoMergeConnections - Disabled...
                Loop...
                    Merge With List : 4 ms
                Loop : 4 ms
                Filter : 1 ms
            DoMergeConnections - Disabled : 6 ms
        LoadConnectionsFromDataSource : 765 ms
        Load connection overrides...
            Has changes...
                DVLS - Api - GetConnectionOverridesHash...
                    WebAPI.GetConnectionOverridesHash : 23 ms
                DVLS - Api - GetConnectionOverridesHash : 23 ms
            Has changes : 23 ms
        Load connection overrides : 23 ms
        LoadConnections [Devolutions Server : {ServerName} - Global Vault] - Disabled - 64-bit : 109 ms
        FavoriteManager.LoadFolders...
            DVLS - Api - GetUserRoamingSettings...
                WebAPI.GetUserRoamingSettings : 38 ms
            DVLS - Api - GetUserRoamingSettings : 38 ms
        FavoriteManager.LoadFolders : 41 ms
        DVLS - Api - GetSecureMessages...
            WebAPI.GetSecureMessages : 46 ms
        DVLS - Api - GetSecureMessages : 46 ms
    LoadConnections UI - [Devolutions Server : {ServerName}] - Disabled - 64-bit : 1189 ms
RefreshConnections : 1189 ms
Connection States: Refresh...
    ClearClosedRunning...
        GetOpenedConnections...
            Opened - by process : 7 ms
        GetOpenedConnections : 7 ms
    ClearClosedRunning : 7 ms
    GetAllConnectionStates...
        DVLS - Api - GetAllConnectionStates...
            WebAPI.GetAllConnectionStates : 15040 ms
        DVLS - Api - GetAllConnectionStates : 15040 ms
    GetAllConnectionStates : 15040 ms
Connection States: Refresh : 15048 ms
Here is the "normal" Log:
Main thread (UI)
----------------------------------------
RefreshConnections...
    LoadConnections UI - [Devolutions Server : {ServerName}] - Disabled - 64-bit...
        HasSecurityChanged...
            DVLS - Api - GetCacheValues...
                WebAPI.GetCacheValues : 134 ms
            DVLS - Api - GetCacheValues : 134 ms
        HasSecurityChanged : 134 ms
        Reload: False - HasSecurityChanged: False - HasChanged: True
        LoadConnectionsFromDataSource...
            LoadDataSourceSettingsFromDataSource...
                GetDataSourceSettings...
                    DVLS - Api - GetRepositories...
                        WebAPI.GetRepositories : 49 ms
                    DVLS - Api - GetRepositories : 49 ms
                    DVLS - Api - GetData...
                        WebAPI.GetData : 561 ms
                    DVLS - Api - GetData : 561 ms - Count : 19
                GetDataSourceSettings : 611 ms
            LoadDataSourceSettingsFromDataSource : 611 ms
            DVLS - Api - GetRepositories...
                WebAPI.GetRepositories : 46 ms
            DVLS - Api - GetRepositories : 46 ms
            GetConnections...
                RDMS.GetConnections...
                    ConnectionInfos.Foreach...
                        DecryptData : 0 ms - Count : 19
                        DeserializeData : 0 ms - Count : 19
                    ConnectionInfos.Foreach : 1 ms
                    Fetched 19 sessions
                    Fetched 0 removed sessions
                RDMS.GetConnections : 1 ms
            GetConnections : 1 ms
            DoMergeConnections - Disabled...
                Loop...
                    Merge With List : 1 ms
                Loop : 1 ms
                Filter : 7 ms
            DoMergeConnections - Disabled : 8 ms
        LoadConnectionsFromDataSource : 675 ms
        Load connection overrides...
            Has changes...
                DVLS - Api - GetConnectionOverridesHash...
                    WebAPI.GetConnectionOverridesHash : 22 ms
                DVLS - Api - GetConnectionOverridesHash : 22 ms
            Has changes : 22 ms
        Load connection overrides : 22 ms
        LoadConnections [Devolutions Server : {ServerName} - Global Vault] - Disabled - 64-bit : 82 ms
        FavoriteManager.LoadFolders...
            DVLS - Api - GetUserRoamingSettings...
                WebAPI.GetUserRoamingSettings : 42 ms
            DVLS - Api - GetUserRoamingSettings : 42 ms
        FavoriteManager.LoadFolders : 47 ms
        DVLS - Api - GetSecureMessages...
            WebAPI.GetSecureMessages : 46 ms
        DVLS - Api - GetSecureMessages : 47 ms
    LoadConnections UI - [Devolutions Server : {ServerName}] - Disabled - 64-bit : 1018 ms
RefreshConnections : 1018 ms
Connection States: Refresh...
    ClearClosedRunning...
        GetOpenedConnections...
            Opened - by process : 4 ms
        GetOpenedConnections : 4 ms
    ClearClosedRunning : 4 ms
    GetAllConnectionStates...
        DVLS - Api - GetAllConnectionStates...
            WebAPI.GetAllConnectionStates : 2448 ms
        DVLS - Api - GetAllConnectionStates : 2448 ms
    GetAllConnectionStates : 2448 ms - Count : 22
    Invoke Refresh : 13 ms
Connection States: Refresh : 2467 ms
TreeView.LoadConnectionList...
    BeginUpdate...
        LoadConnectionInTreeNode : 8 ms
        PreCreateGroups : 1 ms - Run count : 1
    BeginUpdate : 12 ms
TreeView.LoadConnectionList : 12 ms
Load Expand States...
    Expanded: 7 - Nodes : 1667
    Nodes...
        Expand : 0 ms - Run count : 1
        Collapse : 1 ms - Run count : 35
    Nodes : 2 ms
Load Expand States : 2 ms
SelectionChanged - Default...
    RootDashboardOverviewManager.LoadRootDashboardOverView - Quick Load...
        Set DocumentText : 2 ms
    RootDashboardOverviewManager.LoadRootDashboardOverView - Quick Load : 92 ms
SelectionChanged - Default : 100 ms

Thread : 10
----------------------------------------
10 - RootDashboardOverviewManager.LoadRootDashboardOverViewAsync - Full Load...
10 -     DVLS - Api - GetAccessRequests...
10 -         WebAPI.GetAccessRequests : 30 ms
10 -     DVLS - Api - GetAccessRequests : 30 ms
10 -     DVLS - Api - GetVaultAccessRequests...
10 -         WebAPI.GetVaultAccessRequests : 42 ms
10 -     DVLS - Api - GetVaultAccessRequests : 42 ms
10 -     DVLS - Api - GetTodoData...
10 -         WebAPI.GetTodoData : 38 ms
10 -     DVLS - Api - GetTodoData : 38 ms
10 -     Delete if expired : 1 ms
10 - RootDashboardOverviewManager.LoadRootDashboardOverViewAsync - Full Load : 206 ms
Performance Look and Feel is much better for the Employees, but still annoying when switching Vaults.
When i cleanup the Table, as i wrote before, the ConnectionState Loading Time falls to 20-30ms.
Best Regards,
Andreas
Hello Andreas,
Thank you for your feedback.
Our developer team will continue the investigation, and we will get back to you as soon as we have a solution for this issue.
Thank you for being so patient.
Best regards,
Érica Poirier